
What’s goin’ on?
Well, we finally had a breakthrough and have found some solid ground. It seems like all the uncertainty is gone and we can really begin to make some progress.
It’s been three weeks since the election, and we’ve seen a significant market reaction. It seems the changes to monetary policy finally decided to show up in certain areas while not in others. There haven’t really been any surprises. Following the institutional business cycle kind of takes the fun out of it. We’ve known all year these changes were coming; it was just a matter of when.
Wall Street waits for the most opportune time to make their move, and a presidential election presents just such a case. Retail investment enthusiasm is at all-time highs, and that gives financial institutions the opportunity to execute their plans. The areas they’ve been accumulating are ready to advance, and there’s profit to be taken from the sectors they’ve marked up over the past couple of years. These are exciting times that we’ve been anticipating all year.

October Market Confusion
In October, there was a lot of confusion related to the market’s reaction to interest rate cuts. What should be happening wasn’t, and it appeared we should expect more of the same. The seasonal/election volatility turned out to be to the upside as markets surged. Was it enthusiasm about the election results or just time for the institutions to move to the next phase? Hard to say and, in the end, doesn’t matter.
What IS clear, though, is the dynamic has clearly changed. We’re most likely heading into a period where good economic data is good again, and continued policy easing should continue to bolster the lagging sectors of the market.
Small Caps: Recovery in Sight
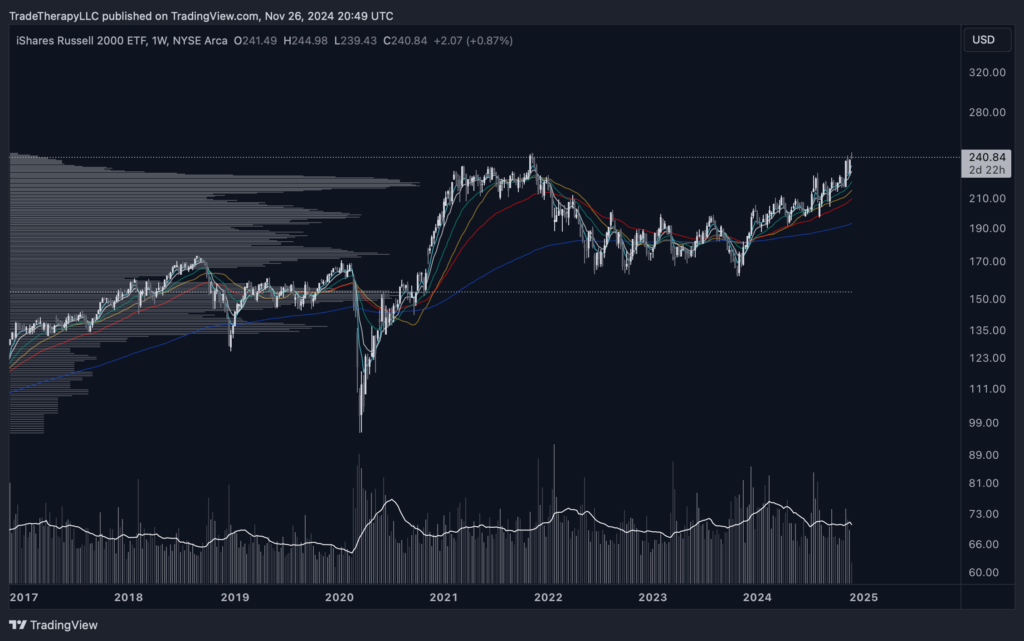
The post-COVID corrective period has been the hardest on small caps. It’s hard to believe small caps have been in this cup base for four years. During that period, we were told to expect a deep recession and very difficult times as inflation was completely out of control. Smaller companies are the most vulnerable during an extended high-interest-rate environment.
Although inflation spiked briefly due to the global supply chain shutdown, it was front-page news for years, and small caps plummeted. Wall Street took advantage and accumulated huge positions.
Now, with inflation ‘under control,’ this clean, longer-term weekly chart shows small caps are ready to move on to the next stage of the cycle. All of the moving averages are aligned properly for the first time since COVID. The thickness of the volume profile really emphasizes the size of the positioning here.
The Fibonacci Connection
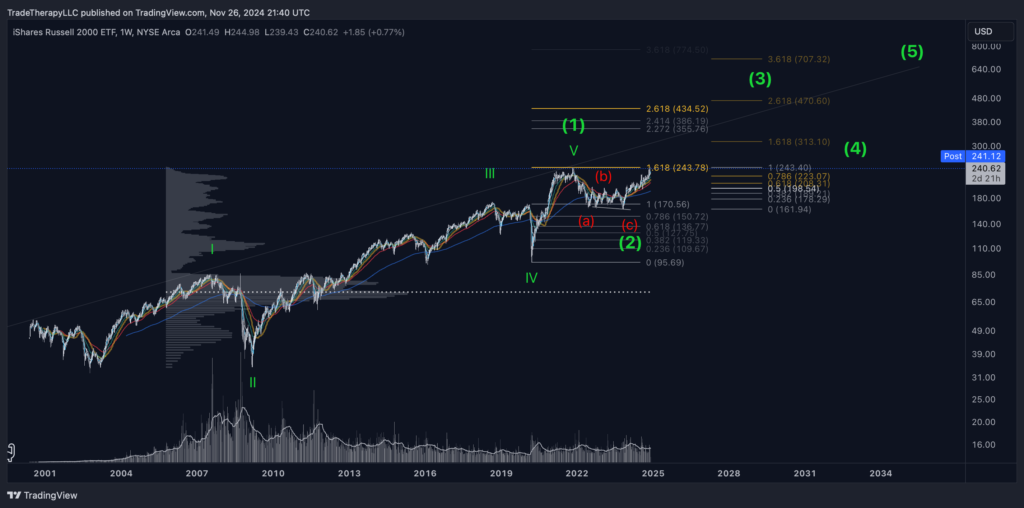
This all-time view of IWM shows a great perspective on how this all transpired. Somehow, inflation really became a problem when IWM hit the 1.618 fibonacci extension from the COVID bottom. Fortunately for Wall Street, it lined up perfectly with their preferred range for taking profit, which they did.
If you’ve ever wondered how well fibonacci retracements/extensions work, consider this: IWM topped out in November 2021 at $244.46, missing its 1.618 Fib by $0.68. If you haven’t yet, start looking into fibonacci retracements.
Updated Wyckoff Chart
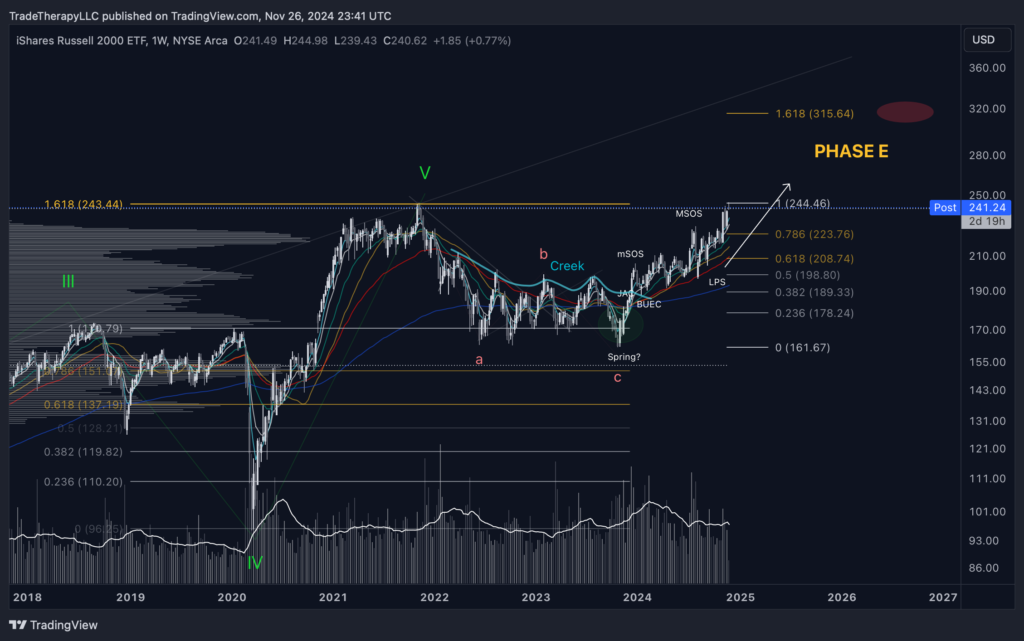
Our updated Wyckoff chart shows the progress IWM has made since October 2023. Remember, coming into 2024, there was no end in sight for inflation and ‘higher for longer’ interest rates. IWM was able to rally 52% in spite of such dire headlines. Another example of how the market ‘loves to climb a wall of worry.’
Truth is, Wall Street loves to use the media to create walls of worry to keep retail out of their trades until they’re ready to take profit.
This is a beautiful, almost textbook example of the institutional buying cycle. It remains to be seen if we see a handle develop here. There’s no divergence to speak of, so we’ll just have to see. So far, there’s strong bullish sentiment heading into December.

Cyclical Wealth Building
We’ve focused on small caps as they’re ready to enter their next phase and present great opportunities. Building wealth across cycles requires participating in those cycles.
- Get involved in the bottoming process.
- Ride the trend until it distributes. (riding giants)
- Switch to the short side to ride the cycle back down.
This is how you build wealth across cycles and what our focus is at Trade Therapy. It takes discipline, patience, and determination, but the rewards are significant and can be life changing.
Later, we’ll look at some specific examples from this space that look interesting.
How is that affecting things?
Suddenly everything is working again. All the plans we made are all coming together. It’s really exciting!
Last month, we discussed some of the strategies employed by financial institutions to control certain sectors of the market. Because financial institutions have access to information sometimes years in advance and practically unlimited resources, it’s very easy for them to manipulate components of the market to achieve their goals.
When it’s time to take profits in certain sectors, components of the market that may impact that sector are suppressed until the institutions have exited their positions. Once those profits have been realized and short positions have been taken, the downward pressure on those same components is removed, and the assets soar, sending their short positions rocketing higher.
Getting frustrated or angry about it is a waste of time. It’s better to recognize it, learn to analyze those components for possible upcoming changes and align with the direction those components will lead. This is the essence of Trade Therapy and why we spend as much time as we do discussing these components. If our members can learn to recognize how these components affect their portfolios, they’ll be able to make more well informed decisions and keep their investments on the ‘right side’ of the trade. The ‘right side’ is always the side that Wall Street is on. They never lose. The challenge is being able to determine which side that is in a world overflowing with mis(or dis)information.
Dollar Index and Rate Cuts

This was our US Dollar Index (DXY) chart from October’s edition of From The Trading Couch. We discussed the reaction to the first rate cut and how financial institutions were pushing the dollar higher to test the market reaction in their newly acquired positions.
A strong dollar hurts risk related assets and other areas of the markets that were beaten up during the post Covid correction. These were areas of the market that formed institutional accumulation ranges for the past several years. A strong dollar provides the impression that sectors will continue to struggle, potentially keeping retail investors out of these positions.

Here’s the same weekly chart today. DXY has formed an upthrust after distribution (UTAD). This is a Wyckoffian term that refers to price breaking above the top of the range (redistribution in this case) after distribution has been taking place for some time. A UTAD is used to take out all of the stops from short positions that have been placed just above the previous highs. It is also used to mislead retail investors into believing the asset is breaking out and about to continue the previous uptrend. This allows Wall Street to take profit from the long position they took at the bottom of the range and acquire their short exposures. They know lowering interest rates and a rising dollar are in conflict. They just don’t want YOU to know.
A couple things about this chart jump off the page. First, the Relative Strength Index (RSI) on this weekly chart went from an oversold condition straight up to an overbought level. This, after the first and second rate cut! Notice how long it took the RSI to reach an overbought level (white dotted line at the top of the bottom pane) while it was fueled by the fastest rise in interest rates we’ve ever seen. That process took 16 months. This time, it took 2.
Second, consider the United States Dollar, the global currency, has had the exact same reaction to the first rate cut as it did to the first rate increase. Why would financial institutions want the dollar to rise so rapidly? It puts downward pressure on the assets they’ve been accumulating and hopefully stopping out all the retail investors that had joined those trades. Any of you that joined us in the TMF trade know what we’re talking about. This also dissuades profit seekers from jumping in.
Treasury Yields and Institutional Behavior

All year we’ve discussed how Wall Street has kept the pressure on certain components like bond yields to provide the proper optics for their strategy. We’ve discussed how keeping yields high in the ‘belly of the curve,’ 7–10 year bonds, inverted the yield curve. This provided the media and every attention-seeking poster on X the ammunition they needed to proclaim an imminent recession.
Meanwhile, financial institutions ‘bought the dip,’ and the major indices (S&P 500 and Nasdaq) have set all-time highs, going on one of the strongest bull runs in history.
This was our look at the 7-10 Treasury yield chart in August. At the time, the Federal Reserve was expected to announce the first interest rate cut in September. Yields were falling and everyone thought we would get some relief providing some certainty about the path forward to a retail investment community expecting a recession. This chart appears ready to waterfall down like it always has during easing monetary policy periods in the past.

Once again, we’ve seen typical Wall Street institutional behavior driving yields higher as interest rates have been cut. Instead of bond yields falling reflecting the fundamental change in valuations, yields surged along with the dollar. There are tens of thousands of fund managers that have policies in place that will not allow them to take certain actions until numbers like the 7-10 year treasury yields come down to a certain level. Keeping yields high allows Wall Street to keep the retail investment community out of their trades.

Yields move inversely to bond prices. This view from our June edition of From The Trading Couch shows iShares 7-10 Year Bond ETF ready to break out from this accumulation period. The volume characteristics (bottom) indicate heavy accumulation that can only be generated from financial institutions. Sadly, the retail investment community only generates this kind of volume when they’re buying the top.
At the time, yields had rolled over and were beginning to fall. Inflation numbers were coming down, the Fed was posturing toward rate cuts and sentiment was beginning to change. The long awaited, much publicized, recession hadn’t come and a ‘soft landing’ seemed to have somehow been accomplished.

The breakout we were expecting shot out of the top of this symmetrical triangle pattern. When supply lines such as this are broken, short positions get covered accelerating price to the upside. Institutions typically provide additional support with below average volume to provide the impression of increased demand. This lures in retail investors (chasers) seeking quick profits. The average investor doesn’t understand volume analysis. When much higher than average volume produced a shooting star candle for the month of September (not shown), a backtest of the broken resistance line was inevitable.
This process of converting resistance into support is very common and something all of you should take into consideration when deciding to jump into a breakout. This deep, sharply angled backtest isn’t as common and really falls into the category of a shake out.
Now that this level has been flipped from resistance to support and the chasers have been sufficiently punished, bond prices in the middle (belly) of the curve look ready to begin a new uptrend.
What can we work with?
Now that we’ve dealt with our issues, there’s so many options for us moving forward. Things haven’t looked this good in years.
Trend change is a process that takes time. Institutions are taking profit in some areas of the market while they build positions in others. They need a lot of volatility throughout the process to make their efforts as effective as possible. Data dependent environments such as the post COVID inflationary market are ideal as big swings are somehow justified which is exactly what Wall Street needs to take full advantage of the retail investment community. It’s in these situations where everyday investors are convinced to buy at the top or sell at the bottom. This time was no different.
The good news is once the process is complete, the new trend begins and all the Wall Street’s newly acquired positions transition from mostly sideways periods into more vertical ones. Profit has been taken and redeployed. Suddenly the narratives will change and we’ll be told how ‘investors’ confidence has been restored.
Opportunities Ahead

SPDR’s S&P Biotech Sector ETF (XBI) is a great example of the opportunities presented coming out of trend change. This clean weekly chart shows an ideal long setup with a huge, institutional base that has been built over several years. Bases like this form the support for a multi-year markup campaign. Institutions will be looking for several hundred to several thousand percent returns depending on the sector. XBI presents a great opportunity to align our resources with theirs.
A closer look shows the weekly moving averages have quietly aligned in sequential order including the 55 week exponential moving average (55WEMA, red) crossing the 200WEMA (blue). This is a bullish signal and setup including a late stage shakeout during the election that cleared both sides of the trade as price rose slightly higher than the previous high from March and wicked down below the local low from August. This is the type of price action we’re expecting to see as the new trend emerges from years of range bound conditions.

When a sector ETF like XBI has an extremely bullish setup, it’s time to look at the individual stocks from that sector for similar setups. We covered TWST in June when we took a deep dive into biotech as a rotation target. This is a great example of how similar the climax run at the top is to the selling climax at the bottom.
The large cup base that has formed shows the classic signs of institutional accumulation. High volume throughout the period peaking at the bottom indicates Wall Street has taken their position. TWST missed their earnings numbers (not revenues) on Aug. 2 and subsequently saw price sell off 26%. It has been held at the same relative price level ever since on low volume. Why? All the dip buyers expecting to make a quick return flooded in after earnings. Take a closer look at the volumes over that period. Holding prices at this level frustrates retail traders who exit their positions as they find another opportunity to chase. Yet another example of the tactics used by professional money to create the path of least resistance. Pushing retail investors out of the trade keeps them from taking profits later that may slow down the markup process forcing institutions to absorb the sellers to maintain the momentum. Better to get rid of them now.

All year we’ve been presenting charts that reflect institutional rotation and accumulation. The same characteristics that we found in XBI and TWST can be found in them including iShares MSCI Emerging Index Fund EEM. We haven’t touched this chart since we included it in September’s edition of FTTC. Here we see the same sharp upthrust with a reversal forcing out new long entries.
The tickers may change but the tactics remain the same.
Trade Considerations: Key Strategies for the Coming Months
Our trade considerations remain the same as the trend is just now changing. All of these opportunities are trades we’re considering for the cycle. What does that mean? That means each of these opportunities have built institutional bases and should produce strong uptrends for the foreseeable future. We’re expecting giant moves and we’ll be riding them. This is what we mean when we refer to ‘riding giants’. We’ll be updating these sectors and trades throughout as we continue to break down the institutional business cycle.
Our high-conviction trades focus on the normalization of the yield curve, emerging markets, small caps and interest rate sensitive stocks like growth and biotech.
It’s important to note that these are not recommendations or financial advice, but rather insights into potential opportunities we’re considering.
- Yield Curve Normalization: We remain heavily focused on opportunities related to the normalization of the yield curve, including long positions in TMF (3x Bull ETF for TLT) and potentially IEF (7-10 Year Bond ETF). These high-conviction trades are rare and present significant upside potential. Patience is required.
- Small Cap Opportunities: We continue to see value in IWM and its leveraged ETF counterpart, TNA.
- Emerging Markets: We remain long YINN (3x Bull ETF for China) and FUTU, DADA & BABA. SE looks attractive as well. We’ll add or enter when price backtests and holds one of the shorter term WEMA and scale in should we see longer term WEMAs which we don’t expect. EDC is another attractive leveraged emerging market ETF.
- Interest Rate Sensitive Charts: We’re long both ZM & PYPL and feel both are good long term holds for this next cycle.
Remember, practice responsible risk management at all times.
Final Thoughts
We often comment that financial institution’s top priority when it comes to the markets is deception. Considering our coverage this month, this should be becoming obvious. All year we’ve presented evidence of Wall Street using the media to create a narrative that doesn’t align with their plans or the underlying data. This month, we showed you some of the tools they use (bond yields, $USD) to mislead retail investors to sell what they’re trying to buy and buy what they’re trying to sell.
Now, more than ever, it’s time to remain focused on the data. Numbers never lie.
Hope everyone had a Happy Thanksgiving and Happy Holidays!
Special Offer: Black Friday Sale
If you haven’t yet, consider taking advantage of our Black Friday Sale. Those that joined us earlier this year on our Independence Day Sale, this expires next month. Your account will be automatically switched to month to month full price. If you would like to take advantage of our offer of 50% off for a year, go into your account, cancel your current membership and resign up here https://bit.ly/4fP35xn
Annual subscriptions also make great Christmas presents!!!
2 responses to “Up, up and away…”
-

Do you have 2025 targets for TMF, TNA and YINN?
-
Most of these trades have been covered in FTTC’s recently. The fibonacci target levels will not change in any of these charts unless a new low is made. Then the targets would just extend higher. TNA targets are $60 then $80. TMF’s are $72.82 then $108. Yinn $78 then $135. We’re seeing obvious bullish signals in all of these. Each of these targets should easily be met this year. We’re actively in them and covering them this week.
Moving forward, consider the longer time frame fibonacci targets in our charts to be hard targets. A sell off after earnings or some headline drama isn’t going to change the targets. They may get delayed as we’ve seen the past couple of years but they’re won’t go away. Institutional money expects returns when they take out positions as large as they have in these trades. They may not come this week or month or even quarter but they will come.
-
Disclaimer: Trade Therapy, L.L.C. content is intended for US recipients only and is not directed at UK recipients. Our information and analysis do not constitute an offer or solicitation to buy any security and are not intended as investment advice. Content should be used alongside thorough due diligence and other sources. Opinions and analyses are those of the author at the time of publication and may change without notice. Trade Therapy, L.L.C. and its employees may move in or out of any trades detailed within our content at any time at their discretion. Employees and affiliates of companies mentioned may be customers of Trade Therapy, L.L.C. We strive for transparency and independence, and we believe our material does not present a conflict of interest. All content is for educational purposes only.
Leave a Comment
You must be logged in to post a comment.