
What’s goin’ on?
We’ve worked really hard to get to this point, now everything has changed so much. I feel like we’re in a much better place and ready for what comes next.
Finally, the Shift We’ve Been Anticipating
After nearly three years of navigating through scary headlines, the moment we’ve been preparing for is here—monetary policy change is happening. We’ve been diligently researching and identifying clear signals across various markets, and now that the shift is taking place, it’s time to focus on what lies ahead.
Positioning for the Next Phase
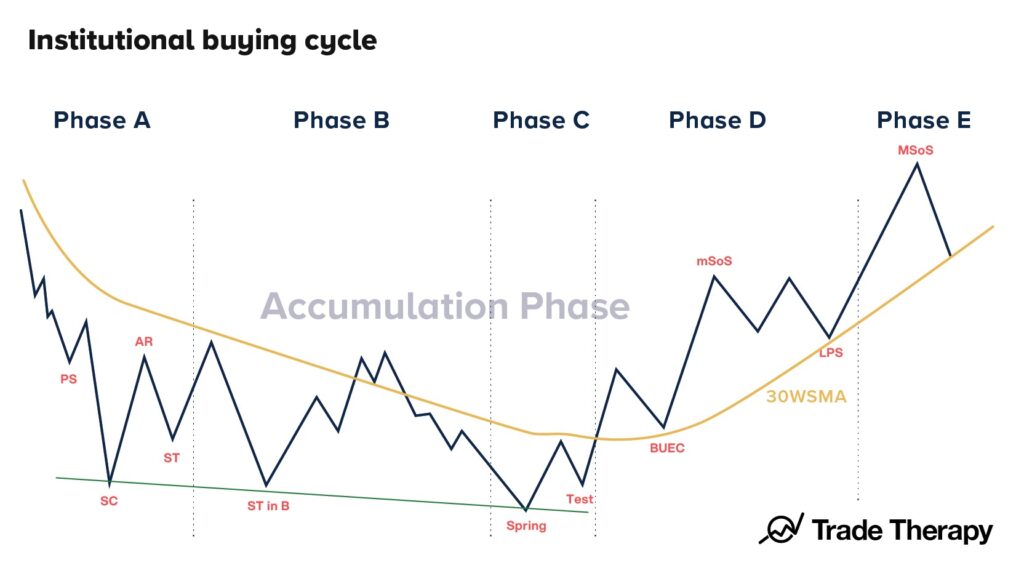
Until now, our efforts have been centered on pinpointing accumulation stages within interest rate-sensitive sectors. These opportunities allow us—and our members—to align with Wall Street institutions, positioning ourselves to capitalize on the upcoming phase. We’re well-prepared for this next chapter, and we’re going to revisit the data we’ve been tracking all year, update our charts, and analyze the effects of the impending interest rate cuts. As trend change progresses, we’ll pivot from late-stage accumulation strategies to early-stage markup and uptrend signals. We’ll kick things off by examining the institutional business cycle and Wall Street’s strategies for this phase.

Confirming the Rotation: What’s Next?
This month, we’ll validate our observations by diving into the latest data and getting ready for what’s next. It’s important to recognize the seasonal weakness often seen in September and October, especially in an election year, which could heighten volatility. We’ll kick things off by examining the institutional business cycle and Wall Street’s strategies for this phase.
Some of you may have already noticed the rotation we’ve been discussing over the past couple of years. This rotation has been creating the accumulation patterns we’ve been analyzing. The public unveiling of this rotation happened in July, as funds began moving out of overbought mega-cap tech stocks and into smaller cap, higher beta assets. In March, we talked about how lower interest rates directly impact the fundamental value of certain market sectors. Now, these interest rate-sensitive areas are advancing to the next stage of their cycle.
Analyzing Market Reactions and Strategic Positioning
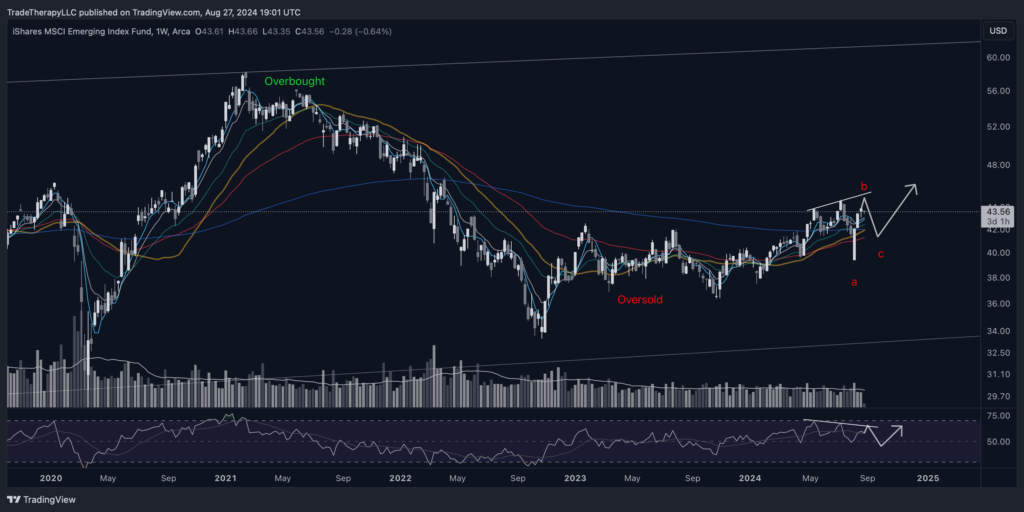
Over the past few months, we’ve closely monitored the setup leading into the September/October seasonality. Historically, these have been the worst months during election years for the past three decades, so volatility is expected. Interest rate-sensitive areas, like emerging markets, are already reacting to the announced policy changes.
Looking at the weekly chart for the iShares MSCI Emerging Market Fund (EEM), you’ll notice a bearish divergence between the Relative Strength Index (RSI) peaks and the price peaks, signaling weakness. This aligns with our speculative path forward, which, when coupled with election seasonality, suggests a bullish setup heading into a new administration this November.
We’ve discussed these trend change conditions throughout the year, so it’s no surprise that this accumulation phase culminates in the midst of election year seasonality—it’s a perfectly managed scenario.

We’ve discussed these trend change conditions throughout the year, so it’s no surprise that this accumulation phase culminates in the midst of election year seasonality—it’s a perfectly managed scenario.
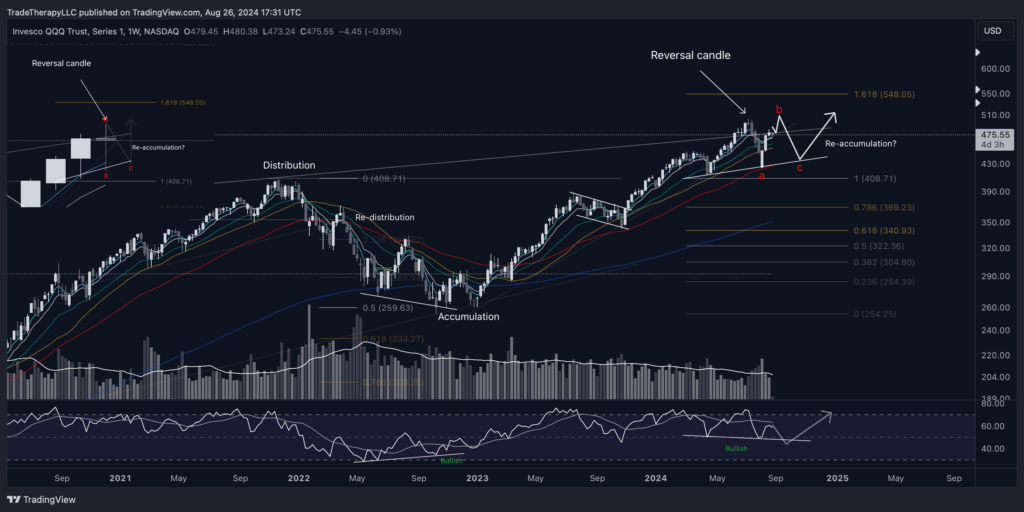
In July’s issue of FTTC entitled ‘Tipping Point?’, we reviewed QQQ and decided to watch it closely to see if it developed reversal candles at the all time resistance or supply line. This is a weekly chart with a close view of a 3 month chart in the upper left. ⅔ of the way through the current candle and the 3M chart has a hanging man candles developing. There’s still time for the price to invalidate it. But for now, that’s a reversal candle. We also see a reversal candle on the weekly.
All of this points to volatility and favors trend change. When trend changes and what was coming down starts going up and vice versa, you expect ‘climax’ runs. This is the last push of the larger operators taking out the last little bit of liquidity that they believe exists. Once this is completed, the assets that have been under accumulation should begin their new uptrends.
A further rotation out of the large/mega cap tech into risk assets is likely to continue. The old saying is ‘investors like certainty’. We just received the news that monetary policy is changing. This is certainty and represents the data we have in front of us. Interest rates are coming down and we’re positioned very well to take advantage.
How is that affecting things?
We’ve committed to the changes we discussed. Things are working out really well. All the signs are pointing in one direction. Up!
The Impact of Interest Rate Cuts
The Federal Reserve’s pivot has finally arrived, although news of its delay will likely be debated. Supply-side inflation persisted only as long as supply issues existed, and once those were resolved, government-issued inflation numbers didn’t quite reflect reality. Instead, we were fed a narrative that good economic indicators were somehow bad for the market, pushing it further down.
The calculation methods for inflation shifted focus over time, first highlighting used car prices and later housing costs. These changes, coupled with lingering COVID-19 effects, extended the accumulation phases in interest rate-sensitive sectors, giving Wall Street more time to invest in sectors that would benefit most from easing monetary policy.

Monitoring Current Market Conditions
The current U.S. inflation chart reflects the climactic nature of the post-COVID economy, peaking at 9.1% in June 2022 before dropping to 3% a year later. Despite the sharp decline, the Federal Reserve took another 14 months to consider reacting to a lower inflationary environment. The fear of another global event disrupting the supply chain, like COVID-19, kept the narrative of an imminent recession alive among retail investors.
However, as we’ve consistently emphasized at Trade Therapy, aligning with institutions during monetary policy changes is key to unlocking life-changing gains. The idea of another generational disruption so soon after COVID is highly unlikely, yet it served as the rationale for a historically tight monetary policy that extended well beyond its necessity.
Strategic Moves and Positioning
While these conditions persisted over the course of the past two years, mega cap tech has completed an impulsive recovery phase coming out of COVID lows. Over the past quarter, we’ve been presenting evidence of rotation out of these sectors into higher beta, risk assets that will benefit the most by lower interest rates.
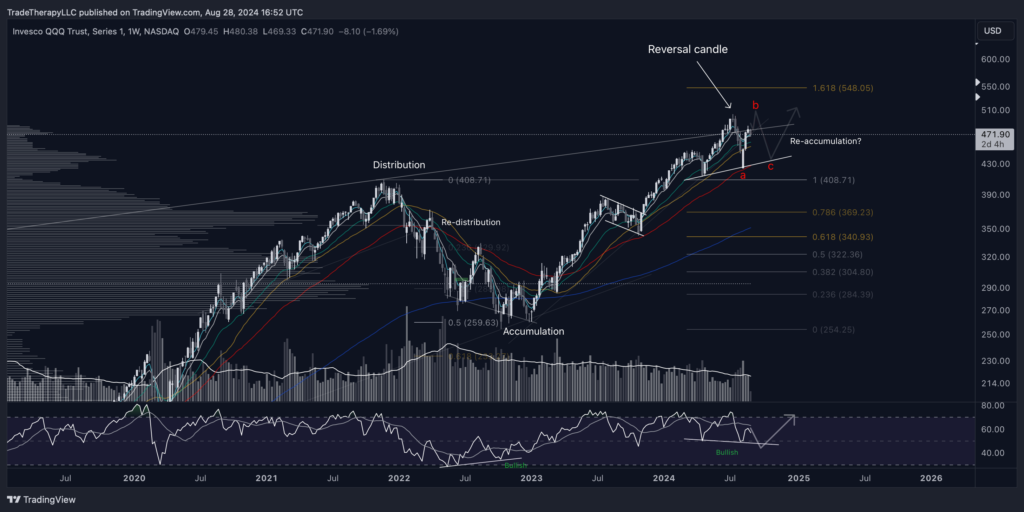
This is our QQQ weekly chart that we reviewed last month. We’ve added some institutional activity levels identifying where Wall St. took and sold their positions. As we said in our Clarity Spotlight on ARKK July 12th:
“Throughout the year, we’ve discussed trend change and the opportunities created during these periods. We’ve identified profit-taking activities creating top-heavy volume profiles and accumulation phases with bottom-heavy profiles. The bottom-heavy ones are the ones we’re focused on as this indicates Wall Street is taking a position.
Our goal at Trade Therapy is to make sure that we manage our investments alongside the institutions and help our members to consider doing the same. These extended accumulation cycles that we’ve seen are obvious signs of rotation that are in advanced stages.”
Committing to changing their policy stance, the Fed has clearly signaled the fundamental valuations in the markets are going to change. Retail investors don’t understand that lower interest rates leads to a lower $USD, higher med/long term bonds and higher value placed on future earnings. This immediately changes the valuation dynamic in ‘risk’ or growth related assets. They’ve been suppressed for the past 2.5 years due to the concerns that we’re going to see even higher interest rates and a prolonged, deep recession. This is how it’s been presented. Oddly, we’ll look up in a few years and the JPM Chase’s of the world will be declaring record profits out of sectors like Emerging Markets.
With the Fed’s policy change, the fundamental valuations in the markets are set to shift. Retail investors may not fully grasp that lower interest rates lead to a lower USD, higher mid/long-term bonds, and increased value in future earnings. This shift directly changes the valuation dynamics in growth-related assets, which have been suppressed due to the fear of even higher rates and a prolonged recession.
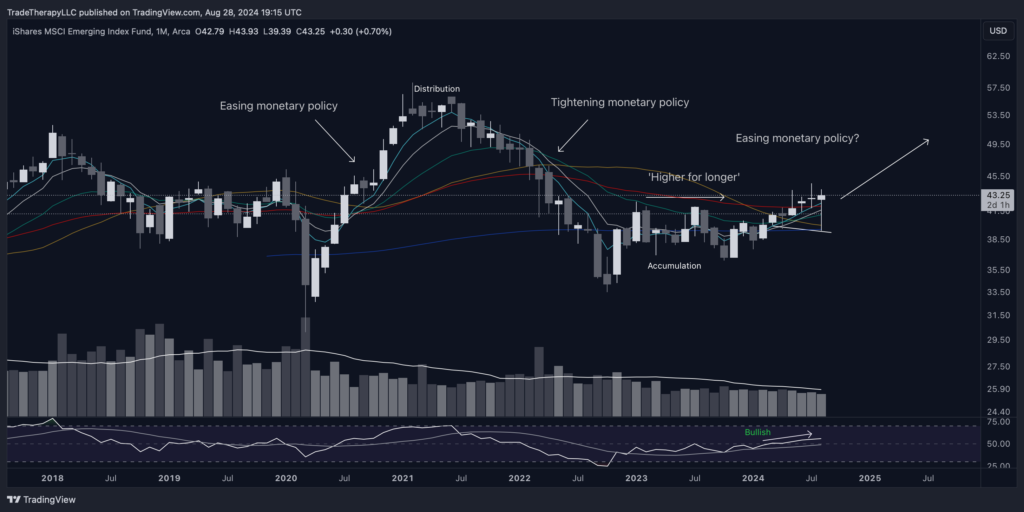
Here’s the monthly view of the EEM chart we presented in our May edition of FTTC entitled Late Stage Tactics. Displaying strong momentum indicator divergence. The dips have been bought and a hammer candlestick is formed. The hammer is formed as the supply vs. demand condition changes. Sellers are unable to keep prices down and have lost control.
EEM has set a higher high and is currently holding upward sloping 5, 9 & 21MEMAs. Demand > supply conditions appear to be taking over and have been for the past several months.
Disclosure: No current position in TNX. Long TMF
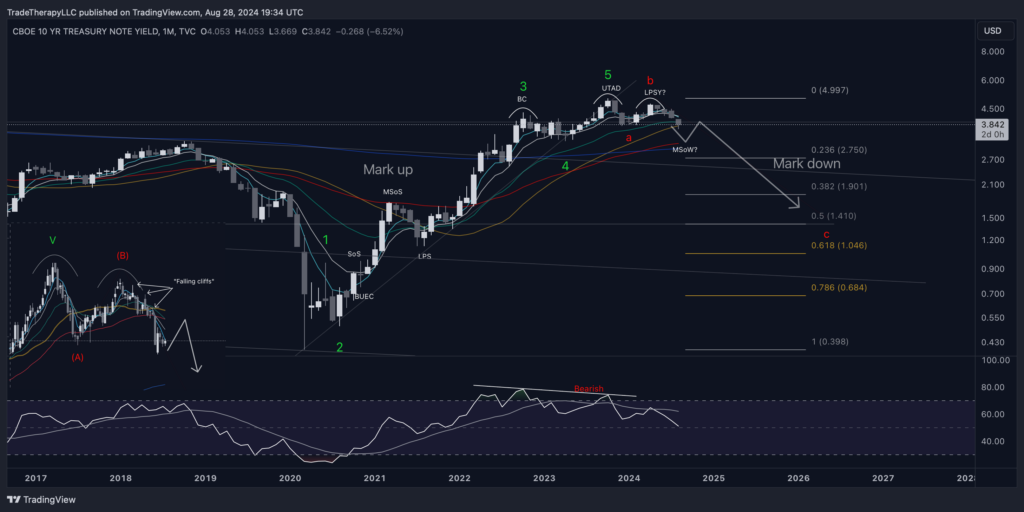
A quick glance at TNX, US 10Y Treasuries, the middle of the curve that we’ve been covering all year. We see the breakdown that we’ve been tracking for six months.
This is the same chart we shared originally in February when we first alerted members that rotation was coming. We’re experts at identifying the institutional business cycles. They don’t happen overnight but once the winds of trend change kick in we’ll see prices accelerate.
Here’s the chart from February:
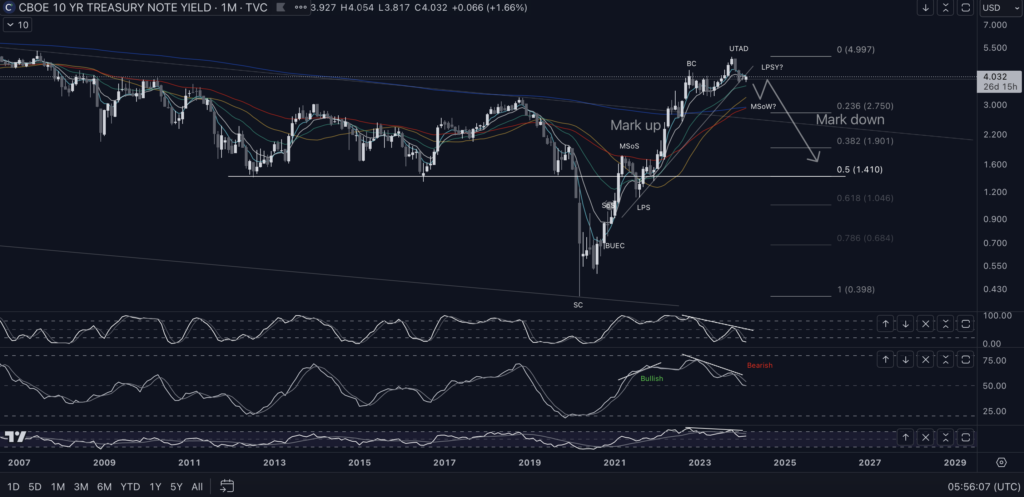
The fundamental conditions of the market that we expected to change are changing. Declarations of an additional drop in the markets because of rate cuts are beginning to look even more remote. A recession would produce an upthrust in this chart. A new impulsive structure would have to form and completely reverse this chart that’s been behaving exactly as it should be for six months now. Possible? Sure, that’s a possible outcome. Would it be unusual? Nothing like that has ever happened before. Ever.
Monetary policy is easing once again. The economics of the previous bull cycles are returning and expecting a different result would be unproductive. The post COVID inflation hysteria can now subside as the narrative changes to reflect a much more positive view of the markets. Uptrends are fun as easing policy makes making money in the markets easier if you’re in the right sectors.
We’ve been presenting evidence of a likely sustained bull market cycle associated with lowering interest rates for months now. If you haven’t reviewed all the previous issues, you’re doing yourself a dis-service. We won’t see trends change like this for several years. Make sure you review all the previous issues and follow us on the socials for updates.
We are going to be releasing some video content soon discussing many of these charts. Make sure you tune into that. Members can now comment directly to articles at TradeTherapyllc.com.
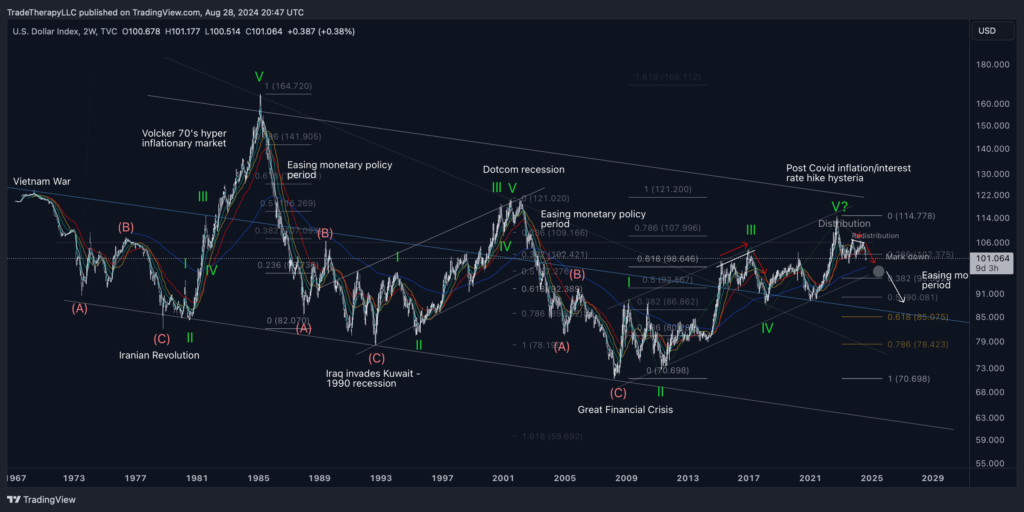
Updating our all time monthly US Dollar ETF, DXY, chart shows follow through to the downside as expected. Seasonal volatility may contribute one last gasp (UTAD) effort to push higher. Otherwise, this structure is breaking down as the outlook for cheaper credit improves. It always does when interest rates come down.
We’ll continue to monitor monetary policy for upcoming changes. Current expectations is continued weakness in DXY and short/mid term bonds. This puts upward pressure on TLT, TMF and the various interest rate sensitive sectors.
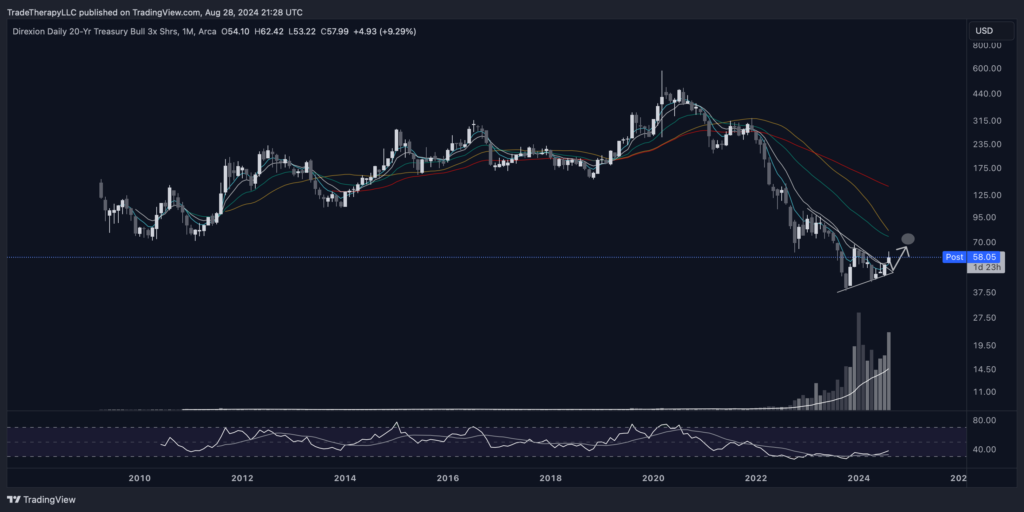
A monthly view of TMF dramatically displays the generational volumes that have been flowing into the long end of the curve. Why would this happen? Because ‘smart’ money has known there was any deep recession coming. They’ve known interest rates would be coming down long ago. It’s their business to know.
Though monetary policy is changing, there have been ongoing concerns regarding price gouging and ‘shrink-flation’. Ask the person who buys your groceries (if not you) if your grocery bills have come down since inflation has dropped so dramatically. Our grocery bills are at all time highs. Trade Therapy is based in Los Angeles, CA. Lunch here is $35-$50. As the narrative has changed, there have been some interesting developments happening right under our noses.
Minimum wage has been on the rise. Most of that community doesn’t participate in the markets so if they’re going to survive, they have to earn more. They’re the first one’s to feel the effect of rising costs.
Costs in general don’t appear to be dropping even though inflation has. Why? We appear to be heading into a very bullish period for the overall markets. We’re facing the seasonally weak period. Once past there, we should see an easing monetary policy uptrend develop that should last for some time.
Could we see valuations rise to support a $50 pizza price tag? It’s hard to believe when not too long ago, $9.99 would get a pepperoni to the door. Bull markets tend to produce euphoric ascents in many sectors of the market. These trend change opportunities we’ve been presenting this year appear to be following through. Mark up periods have historically produced significant returns which would certainly support higher prices for goods and services.
What can we work with?
It seems like sweeping changes have been made. Like we’ve come to a major breakthrough. I’m sure we’ll have some bumps initially, but I think we’re on a great track.
Accumulation patterns are breaking out in the beaten down sectors of the market. The automatic reaction to the change in monetary policy is making it’s mark. Timing couldn’t be better for larger interests always looking for a quick, headline heavy shakeout. Presidential election season is traditionally extremely volatile. We’ve mentioned repeatedly we expect a bullish tenor to the markets for some time after this re-accumulation period. This increases the likelihood of spring events developing at the end of a re-accumulation period.
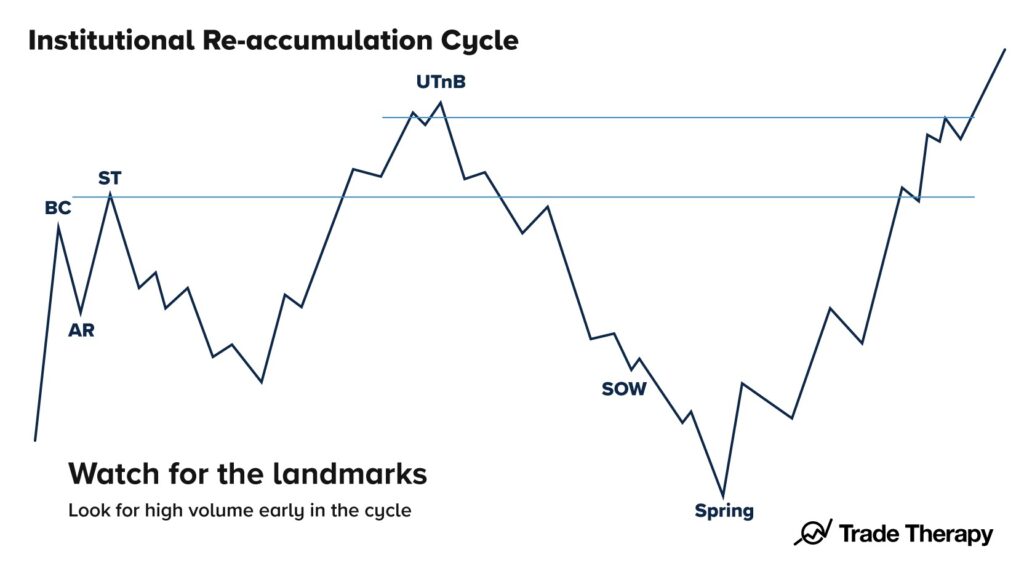
Powell confirming the pivot to easier monetary policy conditions should provide the volume necessary for demand > supply conditions should prevail. These spring events are intended to remove the last of the liquidity at this level. This is part of the cycle and though it can be frustrating to see this develop, it is perfectly healthy. Re-accumulation cycles allow the trend to continue.
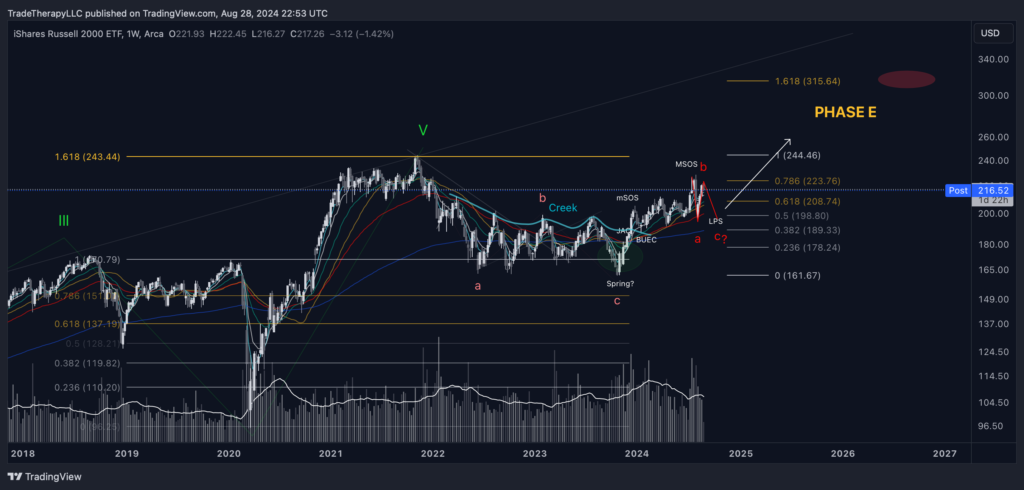
Disclosure: No current position in IWM. Holding a few speculative small cap growth trades.
Revisiting our Russell 2000 Small Cap ETF, IWM, find congestion as overhead supply has an impact. As we discussed before, often price will approach overhead supply then back away sharply. Larger interests are trying to convince those holding losses higher may loose this opportunity to get most of their money back. Sharp drops taking out the local low before the overall trend change effect hits is logical from Wall Street’s point of view.
Russell 2000 Small Cap Index (IWM): A stalemate?
Last month we mentioned the massive base that has been accumulated in IWM. This corrective structure fits nicely into a common accumulation strategy. A final, sharp pullback should be expected before long bull cycles. There’s no reason to believe this time would be any different.
We maintain a bullish stance on all interest rate sensitive sectors of the market. If you’ve been reading our content, you know which sectors those are. If you haven’t been, it’s time for you to catch up. The train is about to leave the station.
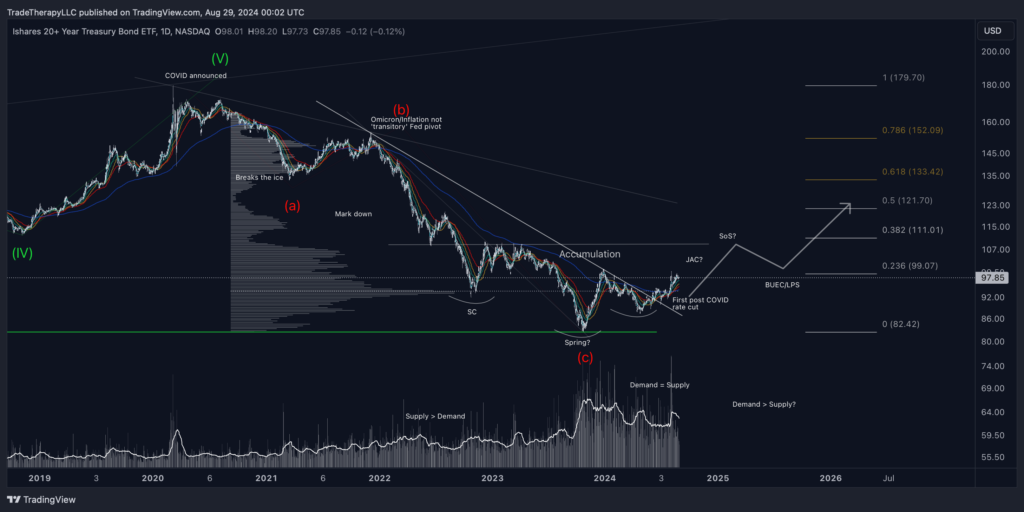
iShares 20+ Year Treasury Bond ETF (TLT): Strategic Positioning
When we last shared our TLT chart, we said:
“Understanding the logic behind these moves—how the narrative is shaped to serve larger interests—gives us an edge in interpreting market signals. This is one of the most valuable lessons we have to share”.
This daily view provides room for us to add the ‘fed pivot’ detail. These events are always interesting to track as the chart fills out. TLT is breaking out on every time frame. The generational base that has been accumulated is historic. A long, sustained mark up campaign in mid/long term bonds appears inevitable and imminent. Considering the impacts of the fundamental change in the valuation of future dollars, this makes perfect sense and should be expected.
This chart could not look more bullish.
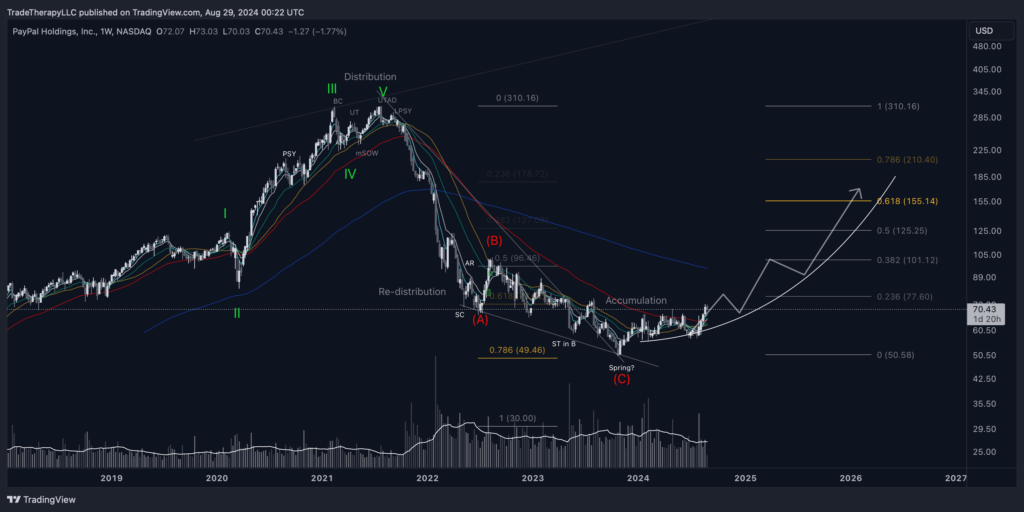
The laggards that haven’t bounced out of their accumulation ranges are setting new 52 week highs such as PYPL & ZM. These assets were seemingly singled out to face the brunt of the negative market sentiment during the post COVID inflation/interest rate hike hysteria.
This weekly chart shows the downtrend supply line finally broken on volume. It’s time for these oversold assets to move on to the next stage of the institutional business cycle which is mark up. Each still needs to ascend the right side of their COVID accumulation bases. We’re watching for JAC opportunities to swing long calls and compound a portion of our long positions.
PYPL should go on to post a series of signs of strength each followed by a ‘throwback’ to one of the weekly moving averages. As the new bull market trend matures, we’ll be trading all of our long positions off of extensions from the longer term moving averages. We’ll sell calls, buy puts and compound a portion of our common share positions.
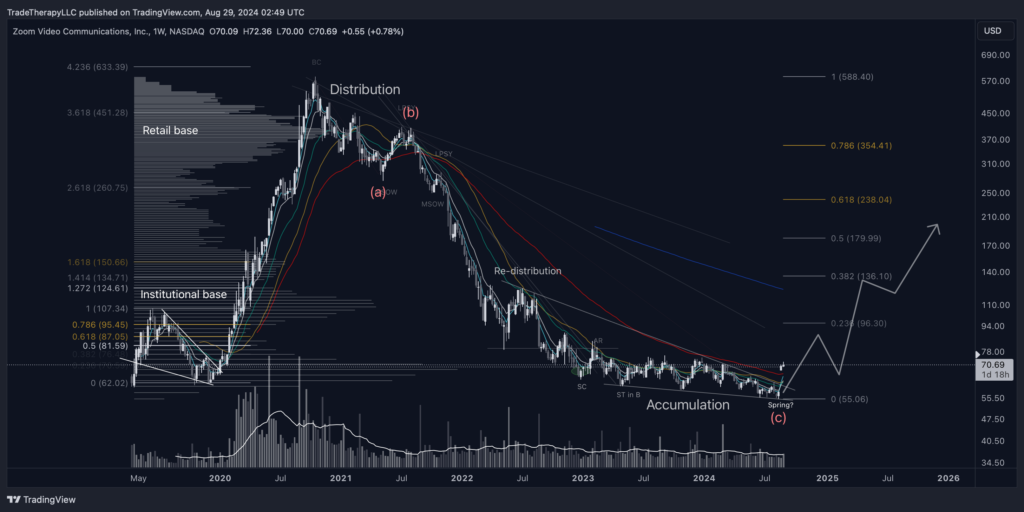
Weekly Chart Analysis: ZM
When you see breakouts out of the laggards it’s safe the say the trend has changed. Breaking above a resistance level gapping up over difficult spots in the chart is a common mark tactic Wall Street institutions adjust their strategy from scaring retail investors away to drawing them in.
Beginning new uptrends will draw the attention of active traders. Those that are in the charts every day and actively digging through social platforms. As deliberate moves such as a potential break-a-way gap like this one is shared and re-shared, retail traders looking for quick gains will come piling in.
It’s important to recognize that even though ZM is breaking out, it’s still in accumulation. It’s just beginning the process that the Mag 7 have just completed. Expect this process to follow a familiar path until it clears the accumulation range.
Trade Considerations: Strategic Moves for the Months Ahead
As part of our new format, we’re including a section for trades we’re considering based on the analysis provided. It’s important to note that these are not recommendations or financial advice, but rather insights into potential opportunities we’re considering.
- Yield Curve Normalization: We remain heavily focused on opportunities related to the normalization of the yield curve, including long positions in TMF (3x Bull ETF for TLT) and potentially IEF (7-10 Year Bond ETF). These high-conviction trades are rare and present significant upside potential.
- Small Cap Opportunities: We continue to see value in IWM and its leveraged ETF counterpart, TNA, especially if the index can navigate the overhead supply and establish a new uptrend.
- Emerging Markets: We remain long YINN (3x Bull ETF for China) and FUTU. BABA & SE look attractive as well.
- Interest Rate Sensitive Charts: We’re long both ZM & PYPL and feel both are good long term holds for this next cycle.
All of these trade possibilities are all in the process of completing the institutional buying cycle. Use the graphic above when selecting long entries. Though the charts may not respect the 30 weekly simple moving average as depicted, most will have an average that can be used to enter a trade against. Practice responsible risk management at all times.
Final Thoughts
Navigating the Road Ahead
We’ve laid out a comprehensive overview of the strategies that have been in play throughout this cycle. As we approach what is historically the most turbulent period of the year, it’s crucial to understand that volatility could go either way. Despite this, history tells us that the S&P 500 has been higher 82% of the time 12 months after an initial rate cut.
So, as the headlines continue to push doomsday scenarios, remember to stick to your plan, follow the charts, and pay attention to accumulation patterns. Exciting times are just around the corner. There are signs pointing to a new, sustained uptrend. We’re looking forward to it even if pizza night gets a little more expensive.
Disclaimer: Trade Therapy, L.L.C. content is intended for US recipients only and is not directed at UK recipients. Our information and analysis do not constitute an offer or solicitation to buy any security and are not intended as investment advice. Content should be used alongside thorough due diligence and other sources. Opinions and analyses are those of the author at the time of publication and may change without notice. Trade Therapy, L.L.C. and its employees may move in or out of any trades detailed within our content at any time at their discretion. Employees and affiliates of companies mentioned may be customers of Trade Therapy, L.L.C. We strive for transparency and independence, and we believe our material does not present a conflict of interest. All content is for educational purposes only.
Leave a Comment
You must be logged in to post a comment.