
What’s goin’ on?
We finally had a breakthrough and everything we’ve planned for is kicking in. It’s really exciting to see the results of all our work. Now we’re adjusting to our ‘new’ reality..
Eye-Opening Results: China’s Response to U.S. Interest Rate Cuts
The effects of the U.S. Federal Reserve’s interest rate cuts are becoming more apparent, especially as China has rapidly responded with massive economic stimulus measures. We’ve previously noted on social media that China would likely act swiftly, and it makes sense. China is still determined to become the world’s leading marketplace, and staying in sync with global economic moves is essential for them.
Now that both the world’s largest and second-largest economies have shifted to easing monetary policies, it’s reasonable to expect that other global economies will follow. Given the market reactions we’ve seen so far, it looks like we’re in for a wild ride ahead.

Historic Rally in China’s Markets
This past week, the China sector saw its biggest rally in 16 years. Throughout the year, we’ve speculated that the China sector was forming a secular low, and now this historic rally is adding even more evidence to support that claim. Seeing numbers like these reinforces our earlier analysis.
We’ve been following this trend closely all year, tracking key indicators that point toward the market’s automatic reaction to these policy changes. Now, it’s time to begin reviewing how these changes are impacting the fundamental valuations of the market. We’re at a critical point, with the institutional business model for emerging markets reaching its extreme—a common phase that often coincides with shifts in interest rates.
Market Reactions and Strategic Positioning
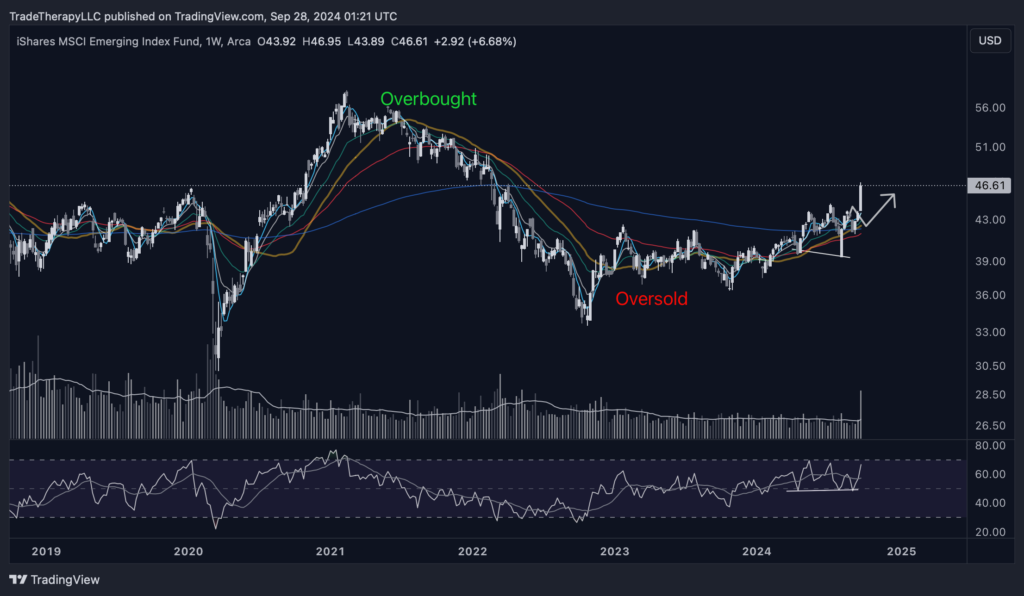
Throughout the year, we’ve highlighted the accumulation happening in interest-sensitive sectors, and emerging markets have certainly lived up to expectations. When the interest rate cuts were announced, the markets reacted positively, reclaiming nearby weekly moving averages, as shown in the weekly chart for the iShares MSCI Emerging Market Fund (EEM).
But things turned historic when news of China’s stimulus broke. We’ve been discussing the extended accumulation phase all year, noting how Wall Street stretched this phase as long as possible. The pinned up buying pressure produced some character changing candles.
This is exactly what we expected. As the highly anticipated Chinese stimulus finally arrived, it triggered a big market move. Now, the main question is whether we’ll see seasonal volatility, especially with this being an election year, and if so, how much it will impact the markets.
iShares China Large Cap Index (FXI) Analysis
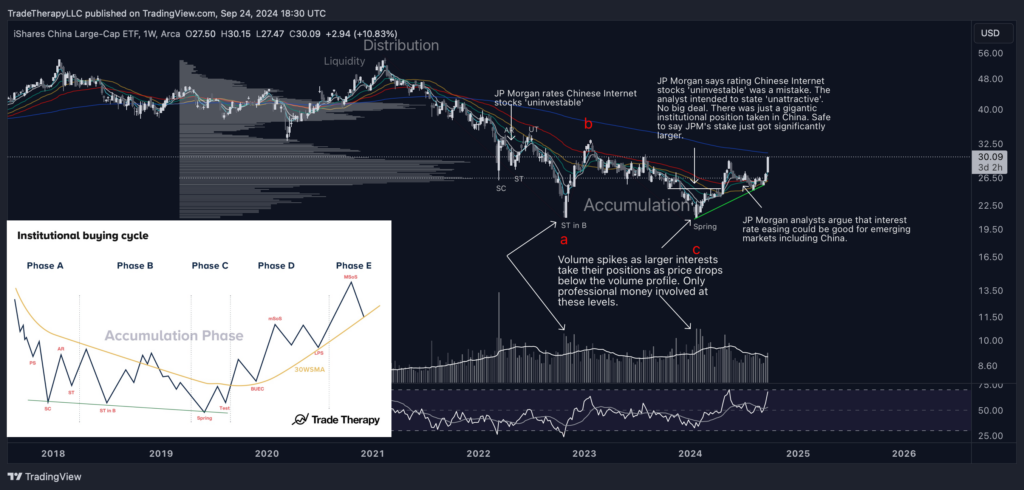
This is our high-timeframe weekly chart for the iShares China Large Cap Index (FXI), a chart we’ve been monitoring throughout the year. As we’ve continued to evaluate the market narrative alongside technical analysis, the chart has been consistently supportive of our bullish view. The positive reception of China’s stimulus news led to a Phase E extension, which set a higher high and confirmed the new uptrend.
As FXI breaks out of its accumulation range, it enters the markup (Stage 2) phase. Over the next few months, we anticipate that FXI will continue to extend upward before retracing back to the lower moving averages. If this really is the secular low we’ve identified, we could be looking at an impulsive market structure that may remain in place for the next decade or even longer. That’s something to think about.
Risk and Reward in China’s Small-Cap Stocks
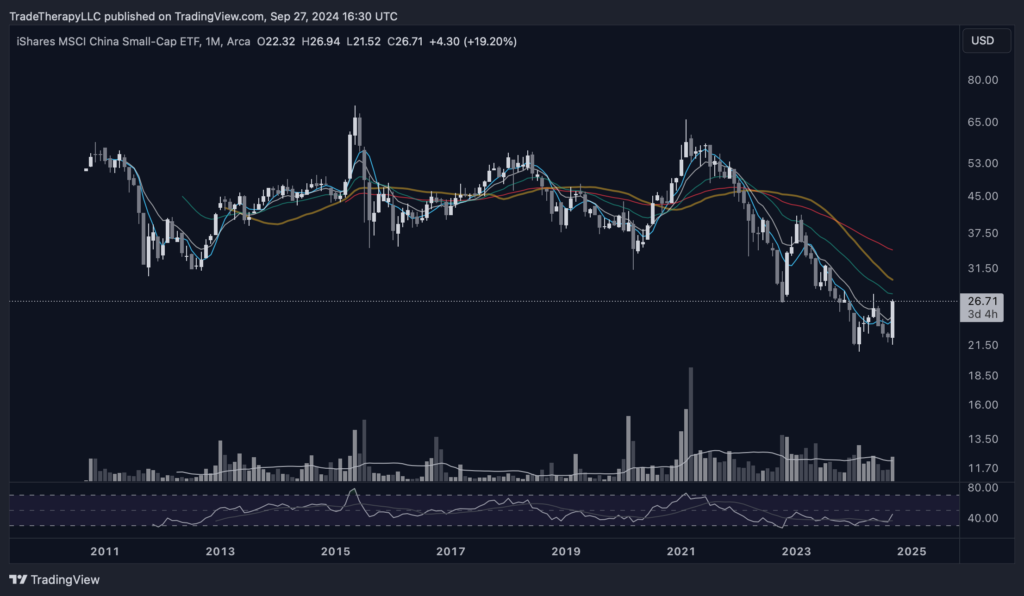
Although large-cap Chinese stocks represent the least risky assets in the sector, small-cap stocks, represented by the iShares China Small Cap ETF (ECNS), have shown an even stronger reaction. These stocks are at the riskier end of the spectrum and tend to react more dramatically to economic changes.
It’s likely that we’ll see a global rally in small-cap stocks, and China will be no exception. The small-cap sector could also provide exciting opportunities for technical analysis. The extreme risk profiles of these stocks often result in more dramatic patterns, which can be easier to recognize and capitalize on.
How is that affecting things?
We’re having trouble trusting the changes we’ve seen. It feels great, but we’re not out of the woods. There will be setbacks. We need to be prepared to keep up the hard work.
The Impact of Interest Rate Cuts: Post-COVID Market Shifts
The post-COVID interest rate hiking hysteria has finally come to an end. However, there are still charts circulating on social media comparing 2007 to 2024, drawing parallels to the breakdown of the Great Financial Crisis. These comparisons have only added fuel to the fire for those inclined toward doomsday scenarios, and the past few years have provided plenty of material for that.
Monitoring Current Market Conditions
As the market digests the changes to interest rates and subsequent changes to valuations, we’re finding confirmations in the charts we’ve been following all year. Monetary policy changes have historically been major turning points that have produced strong uptrends. There’s no reason to expect a different result.
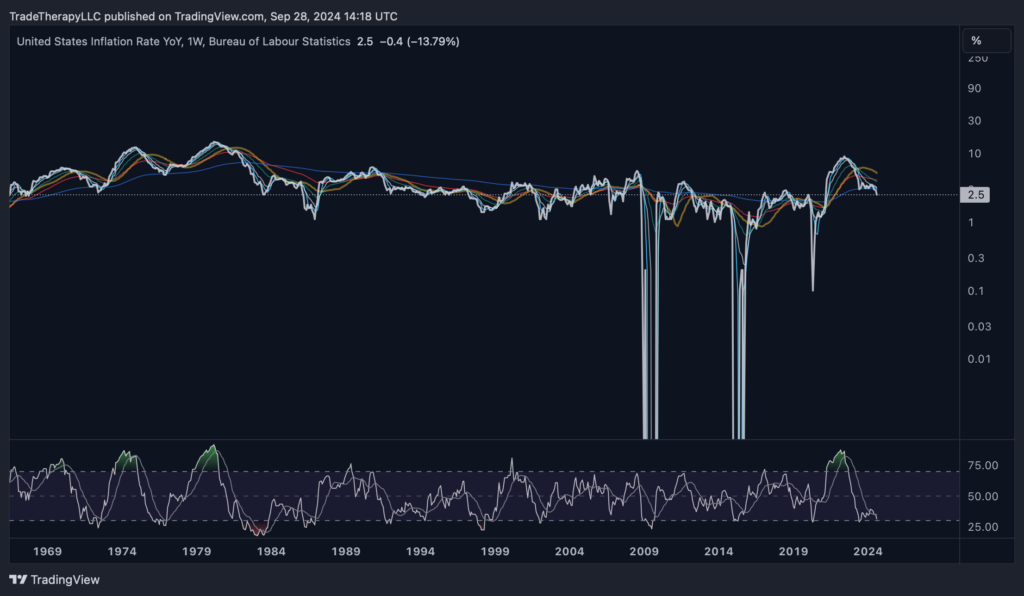
The reality is that inflation concerns should have started easing around June 2023. If you take a look at the charts, you’ll notice a sharp decline and a general downtrend following that point. As we’ve mentioned in previous reports, supply-side inflation naturally resolves itself when supply conditions normalize, and that happened long ago. What remains puzzling is why the Federal Reserve waited an additional 16 months to begin lowering interest rates, a delay that hasn’t received the attention it warrants.
Now, U.S. inflation has broken down and is re-entering a more “normal” range. This is setting the stage for a new narrative cycle as we head into the upcoming presidential election, regardless of how it turns out. We’re likely to see the institutional cycle move into its next phase, one that will be accompanied by a fresh story—potentially involving AI breakthroughs and medical advancements that address everyday problems.
U.S. Dollar Index (DXY) and Redistribution
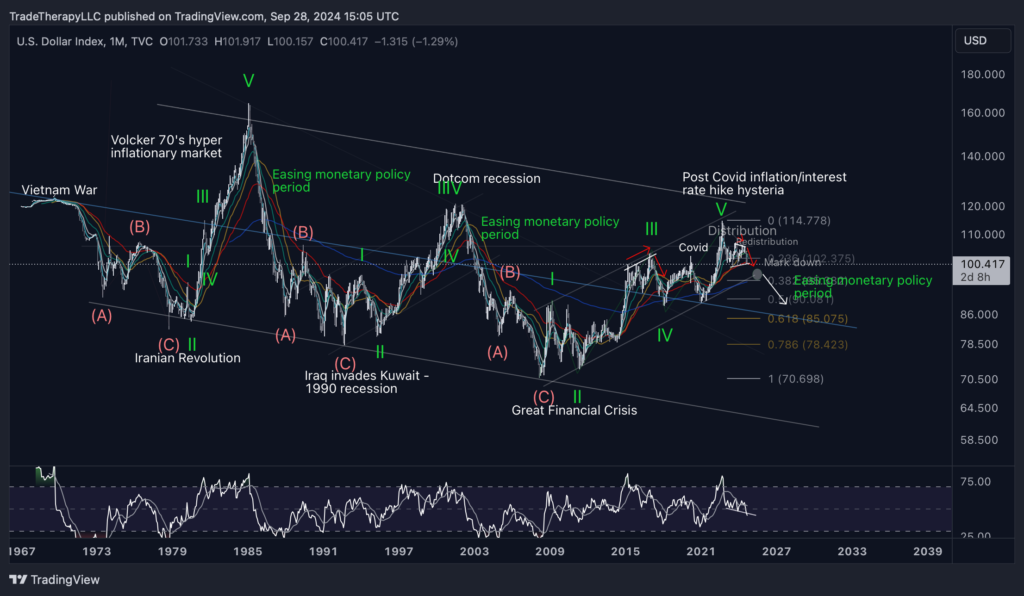
Historically, periods of easing monetary policy have produced some of the longest and strongest uptrends in the market. What’s alarming, however, is how quickly the U.S. Dollar Index (DXY) has started to redistribute. Typically, redistribution occurs when financial institutions can maximize their profits from the process. Many retail investors fail to grasp the complexity and resources involved in maintaining a range-bound trading condition like this, but it’s quite impressive.
What’s even more surprising is how early this redistribution is happening. Look at the green “easing monetary policy periods” and the subsequent red ABC corrective wave patterns. The red B waves represent redistribution phases, which typically don’t occur until much later in the cycle. We’ve been tracking long accumulation cycles in interest rate-sensitive sectors like China all year, and now the proximity of this redistribution phase in the DXY adds further evidence that professional money was trying to squeeze as much profit as possible from these levels.
This setup could lead to a long-running corrective wave, similar to the ones we saw from March 1985 to December 1987 or from February 2002 to December 2004.
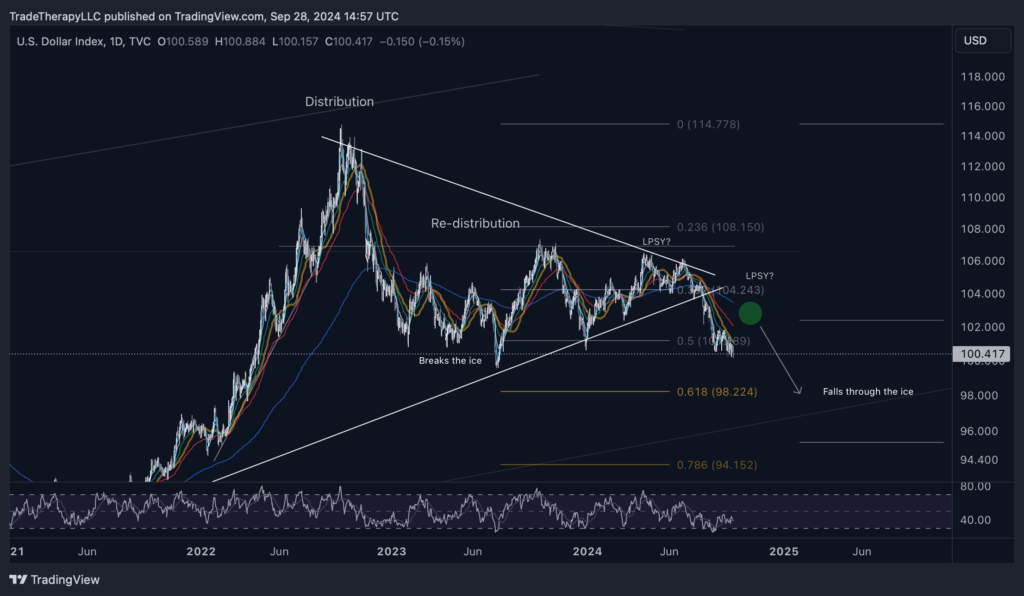
A closer look details the breakdown and it’s inability to retake even the shorter moving averages. Supply > demand conditions are present. There is still the possibility of volatility and a shakeout in October. This short term target for a last point of supply (LPSY) reflects this scenario.
Either way, DXY has broken down and is positioned for an extended down trend. This is inline with the belief that the Fed will slowly walk interest rates down. Look at how DXY has responded during extended periods of easing monetary policy. Slowly walking interest rates down extends the easing period. That extension could go on for years.
We’ll be watching the momentum indicators (RSI bottom pane) on higher time frames. Our expectations are that sellers will be able to keep oversold conditions in place for an extended period of time. Go back and look at the monthly RSI from Mar.’85 – Dec.’87 or Feb.’02 – Dec.’04.
10-Year Treasuries (TNX) and Long-Term Bonds (TLT) Analysis
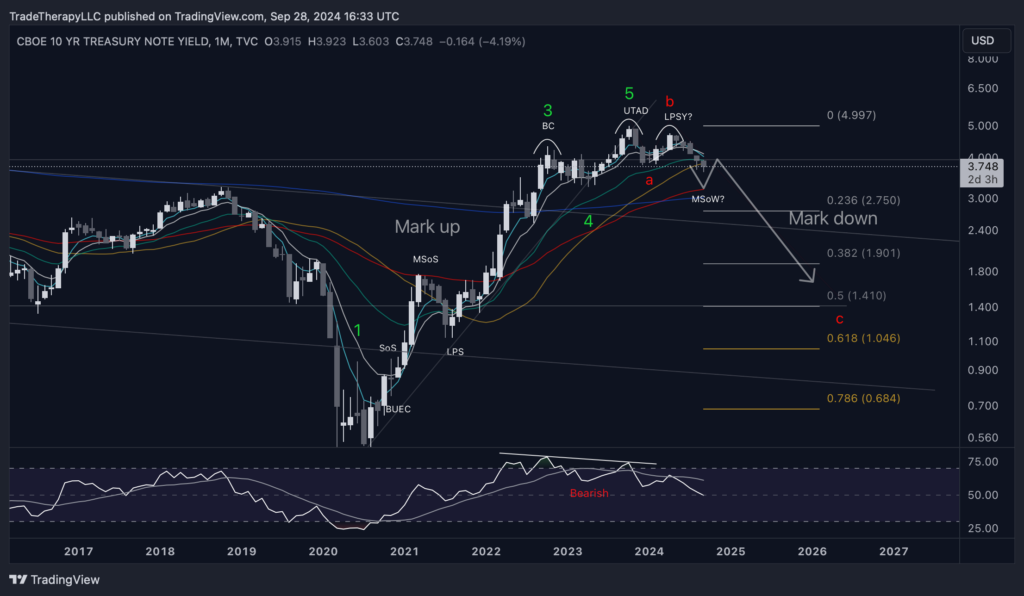
This monthly view of 10-Year Treasuries (TNX) shows the continuation of the distribution process as TNX approaches the markdown phase. The “falling through the ice” setup is clearly present here, and all indications point to the bearish divergence we identified earlier this year, which is continuing to create downward pressure.
As the yield curve normalizes, TNX reflects the middle, or “belly,” of the yield curve and is highly sensitive to changes in interest rates. The slow reduction of rates is creating a perfect environment for TNX to maintain an extended downtrend, which aligns with our longer-term outlook.
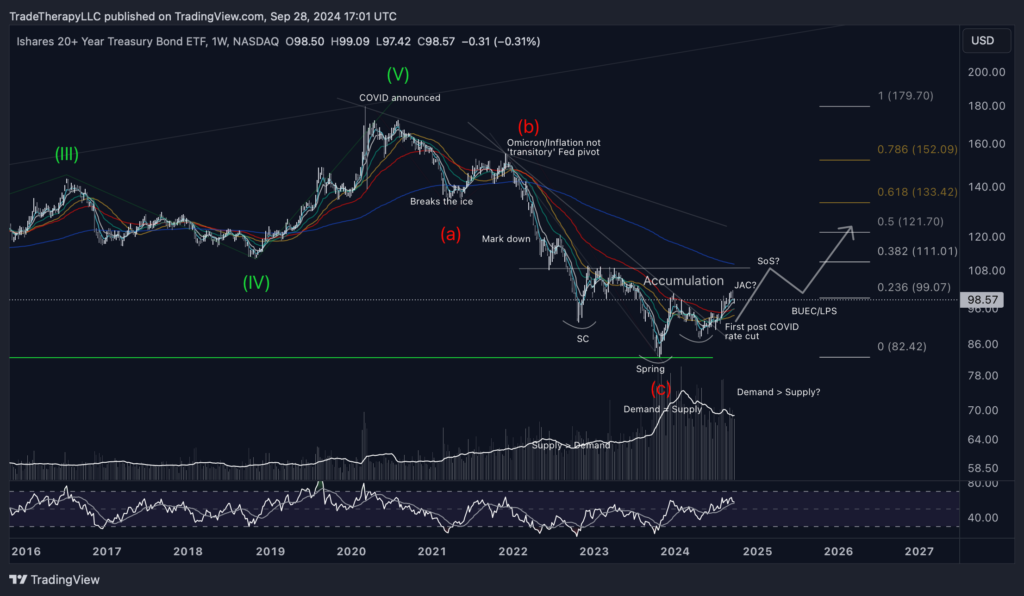
The weekly chart for 20+ Year Treasuries (TLT) presents a textbook example of late-stage accumulation. TLTrepresents the long end of the yield curve, which has been downward-sloping due to the yield curve inversion. Now that the curve is normalizing, TLT is set up for a very strong uptrend that could last for quite some time.
Take a look at the monthly chart and observe how long the momentum indicators (RSI) have remained in oversold conditions. The duration is impressive, and this setup could lead to substantial gains as the trend reverses.
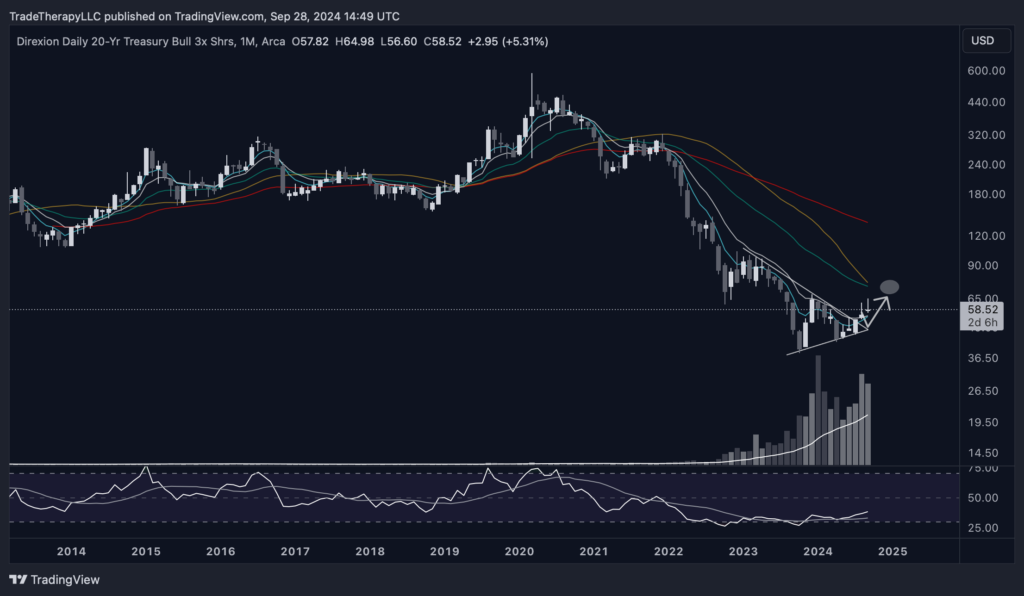
Direxion’s 20 YR 3x Bull (TMF) shows how deep this corrective period has been. This is a monthly chart. Take note of how far price has extended away from the 55MEMA (red). The volume really tells us all we need to know.
Generational accumulation has taken place in the long end of the curve as Wall Street has known interest rates would be coming down. It was certain and the magnitude of the opportunity is really reflected by the level of effort exerted to push prices as low as they have.
The shining example is what has transpired in the China Trade.
What can we work with?
We’re now entering a new phase and we’ll have to adjust our plan. We’ll probably be trying some new things which is great!
The ripple effects of China’s stimulus measures were felt almost immediately, and it was no surprise that China followed the U.S. with its own economic response. As the second-largest economy, China is still vying to claim the top spot, and the speed at which they announced their stimulus plans underscores their ambitions. The impact of their stimulus is already being felt across emerging markets.
One of the sectors that has been most affected by the early redistribution phase in DXY is the emerging markets, particularly in China. We’ve covered beaten-down sectors extensively throughout the year, and the changes in monetary policy are now bringing them back to life.
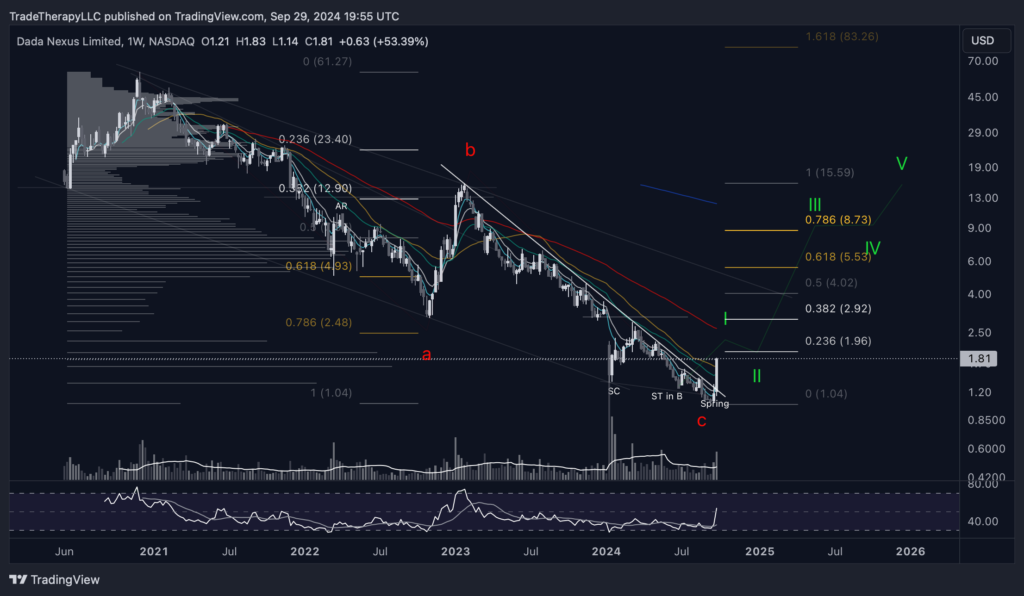
Earlier we discussed the spectrum of risk in emerging markets and how small caps are showing greater sensitivity (larger reaction). DADA is up almost 80% the past two weeks. When economic policy is changing, the extremes of the spectrum bounce the hardest.
Earlier this year we discussed larger operators rotating out of mega cap tech into higher beta assets. This is the beginning of the markup phase that all that money will now benefit from. These incredibly deep, long, extended accumulation patterns that have formed post COVID are the perfect environment for changes to monetary policy.
Because the $USD was held at higher valuations with a redistribution phase while the Fed dragged their feet on lowering interest rates, all of the China assets are at extreme oversold conditions. Check how far they’ve extended below their 200WEMAs. This not only is a great setup for a mean return trade, the overall trend is changing. We should see the longer term averages retaken, converted into support, upward sloping and properly aligned.
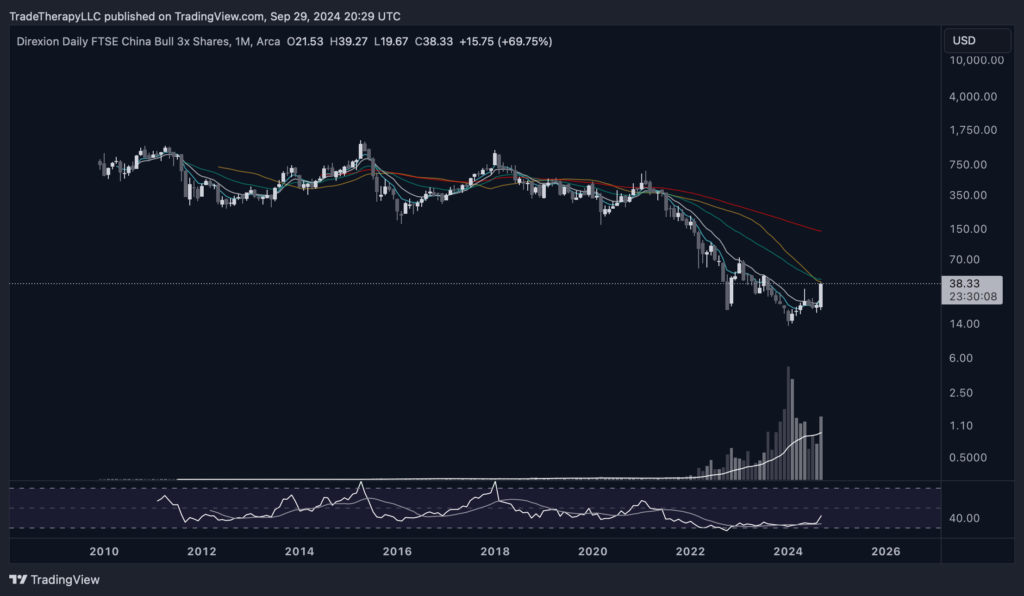
Direxion’s China 3x Bull ETF (YINN) monthly chart really illustrates the depth of the mark down phase. Beautiful JAC surge up to the moving average cluster. $58-$64 is the next level up if this extends further. Eventually, there should be a back up move to retrace roughly 50% of this past week’s candle. If so, we’ll likely add to our long position there.
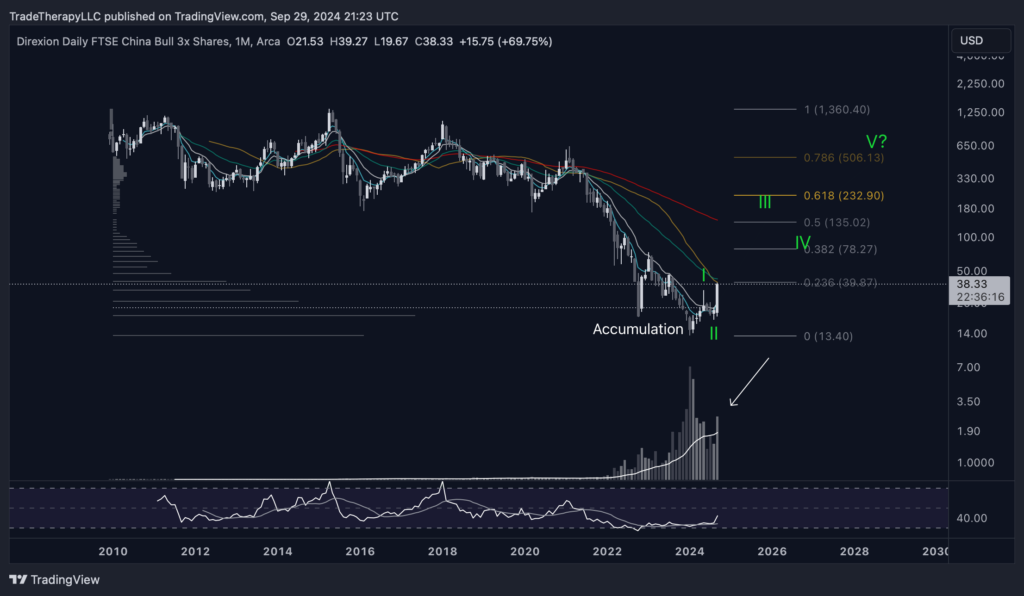
Same chart with some technical details. This speculative Elliott count would reflect an impulsive wave structure. This bottoming structure adds evidence to the secular bottoming thesis for China. Look at that volume. That’s professional money advertising the positions they’ve just accumulated in China. This is how they begin luring the retail community back into a trade after they’ve secured their position. This is what early stage markup campaigns look like and the strategy involved in changing the narrative.
This is one of those obvious signs we run across while doing our research. The China trade is one of the more striking examples of financial institutions creating a narrative with the intent to drive proceeds down so they can accumulate as much as they possibly can. Those of you that have been with us all year should be recognizing the tell tale signs.
China’s economy was considered headline news in the Financial media for almost three years. J.P. Morgan Chase labeled Chinese internet stocks ‘uninvestable’ in April of 2022. When the label began being applied to the wider Chinese market including individual sectors like Real Estate, it was quite clear to us that Wall Street was highly interested in pushing everyone out of the China trade.
Why else would we be told how terrible things were going in China’s real estate market? And, not the entire market per se, as it was really only one or two companies that we were told very little about but we’re to believe it’s only a matter of time before the entire Chinese economy (second largest in the world) collapsed.
Now that the interest rate hike hysteria revolving around the post COVID corrective period is being us, we should see things normalize. Now the Chinese Government is doing exactly what anyone following the data has been expecting, the negative sentiment has changed into something else. Why? Did anything that serious happen in China that should cause us all to re-evaluate our feelings towards China? Of course not, Wall St. has convinced enough people to sell their Chinese holdings. They have filled their positions now and will use their influence to increase the value in them. Bring on the new narrative whatever it may be.

We shared this chart from Jan.’24 in our April edition of From The Trading Couch when we had this to say:
“This is the all time weekly chart. Notice the extensions below and above the trendlines that lead to strong price movements in the opposite direction. These are referred to as false breakdowns or false breakouts and are one of Wall Street’s favorite tactics. We’ll be discussing them in much more detail next month. These trend lines are either demand (at the bottom) or supply (top). Retail traders use them to place their stops either slightly above or below as price has historically respected these trendlines. In an effort to generate liquidity (buy more or sell more), operators will create these false moves to trigger stops in a last ditch effort to take out as many of the ‘weaker’ hands as possible. This is also part of creating a ‘path of least resistance’.”
While the drama has unfolded over the past few years, there have been obvious signs along the way that professional money had big plans for FUTU. By this time in January, we were already holding an oversized position. That didn’t stop us from adding at this point in the chart. It’s a ‘much add’ position.
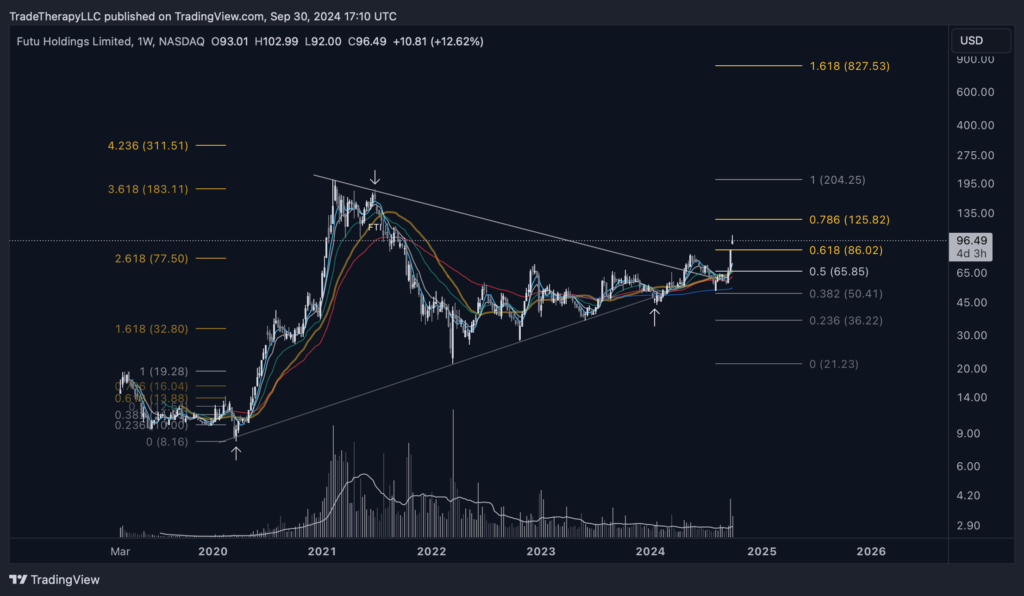
Here’s the same chart today. The unraveling of the massive short trades are all turning into a strong new uptrend that will likely last from some time. We’ll be holding FUTU as a long term hold position for this cycle. This late stage accumulation breakout has a large enough base (cause) built to catapult it to higher levels. Our targets will coincide with the Fibonacci levels and market structure until there no longer is a structure to reference.
Now that the global financial policies are easing again, we should see a global risk on rally that should last for many years. Global pandemics forcing the shutdown of the global supply chain don’t come along very often. Wall St. has made the most of this opportunity to do what they do best, sell the top and buy the bottom. We’ll benefit tremendously by aligning our assets with theirs which is what we’ve done here with FUTU.
Trade Considerations: Strategic Moves for the Months Ahead
As part of our new format, we’re including a section for trades we’re considering based on the analysis provided. It’s important to note that these are not recommendations or financial advice, but rather insights into potential opportunities we’re considering.
- Yield Curve Normalization: We remain heavily focused on opportunities related to the normalization of the yield curve, including long positions in TMF (3x Bull ETF for TLT) and potentially IEF (7-10 Year Bond ETF). These high-conviction trades are rare and present significant upside potential.
- Small Cap Opportunities: We continue to see value in IWM and its leveraged ETF counterpart, TNA.
- Emerging Markets: We remain long YINN (3x Bull ETF for China) and FUTU. BABA & SE look attractive as well. We’ll add or enter when price backtests and holds one of the shorter term WEMA and scale in should we see longer term WEMAs which we don’t expect.
- Interest Rate Sensitive Charts: We’re long both ZM & PYPL and feel both are good long term holds for this next cycle. Although not in any short positions, short exposure to $USD look very attractive for obvious reasons.
All of these trade possibilities are all in the process of completing the institutional buying cycle. Use the graphic above when selecting long entries. Though the charts may not respect the 30 weekly simple moving average as depicted, most will have an average that can be used to enter a trade against. Practice responsible risk management at all times.
Final Thoughts
Navigating the Road Ahead
As we enter the final stretch of the Presidential Election, we’re still on the lookout for a pullback as history has taught us to be. Surely there will be some big stories that can be used to shakeout the market between now the the election right? If so, we’ll be scaling into our existing long positions. Now that policies have changed, the impact of those changes will be felt for years to come.
Otherwise, if we see the market continue to run higher as it’s certainly capable of, we’ll be watching the longer term WEMAs monitoring price’s extension away from it. We’ll then raise stops on the percentage of our position we plan on trading against the WEMAs while selling calls on the rest.
Hope some of you joined us earlier this year in FUTU. We’ve done very well there.
Disclaimer: Trade Therapy, L.L.C. content is intended for US recipients only and is not directed at UK recipients. Our information and analysis do not constitute an offer or solicitation to buy any security and are not intended as investment advice. Content should be used alongside thorough due diligence and other sources. Opinions and analyses are those of the author at the time of publication and may change without notice. Trade Therapy, L.L.C. and its employees may move in or out of any trades detailed within our content at any time at their discretion. Employees and affiliates of companies mentioned may be customers of Trade Therapy, L.L.C. We strive for transparency and independence, and we believe our material does not present a conflict of interest. All content is for educational purposes only.