
What’s goin’ on?
I thought we had our priorities aligned, now everything seems to be changing and I’m not sure what to do. What was working isn’t working anymore.
Current Market Landscape
Throughout the year, we’ve discussed the rotation out of mega-cap tech stocks into higher beta assets, analyzing the accumulation phases that anticipated changes in monetary policy. In July, we finally saw a decisive move tied to this rotation, driven by softer-than-expected inflation numbers.
Last month’s edition of “From The Trading Couch” titled ‘Tipping Point?’ highlighted numerous signals suggesting an impending rotation and trend change. Despite continuing to see similar signals, the latest inflation data should dispel any lingering doubts. The inflation surge following COVID-19 and related interest rate concerns appear to be largely behind us.

Confirming the Rotation: What’s Next?
This month, we’ll validate our observations by reviewing the latest data and preparing for what lies ahead. It’s crucial to be aware of the seasonal weakness typically seen in September and October, especially during an election year, which could amplify volatility. We’ll start, as always, by exploring the institutional business cycle related to Wall Street’s strategies for this next phase.
Some of you may have already noticed that the rotation we’ve been discussing has been unfolding over the past couple of years. This rotation has been forming the accumulation patterns we’ve been analyzing. What we witnessed in July was the public unveiling of this rotation, as funds moved out of overbought mega-cap tech stocks into smaller cap, higher beta assets.
The Institutional Business Cycle: Wall Street’s Playbook
Wall Street has been methodically shifting funds from the overbought sectors, like mega-cap tech, into undervalued, oversold sectors. This strategic repositioning has been ongoing, with profits from the tech sector being reinvested into new uptrends in sectors that have been quietly accumulated. This is the institutional business cycle at work.
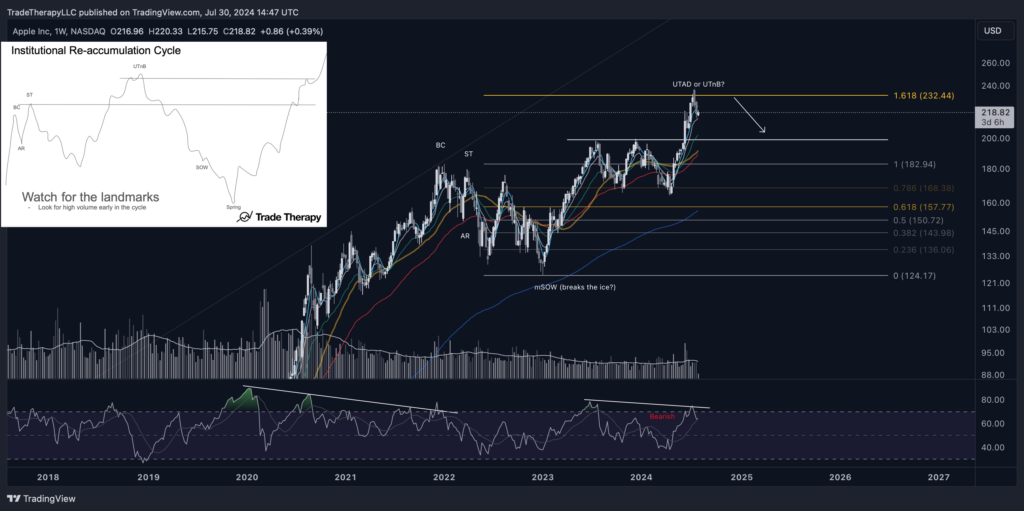
AAPL: A Case Study in Profit-Taking
Our updated view from earlier this month on AAPL exemplifies how the 1.618 Fibonacci level often signals areas where large institutional investors begin taking profits. The combination of an extended Elliott Wave count, bearish Relative Strength Index (RSI) divergence, and key Fibonacci levels made this outcome fairly predictable. Time will tell if AAPL is entering a distribution phase or merely a re-accumulation, but it’s clear that it’s currently overbought in the cycle and represents funds that are likely being re-allocated.
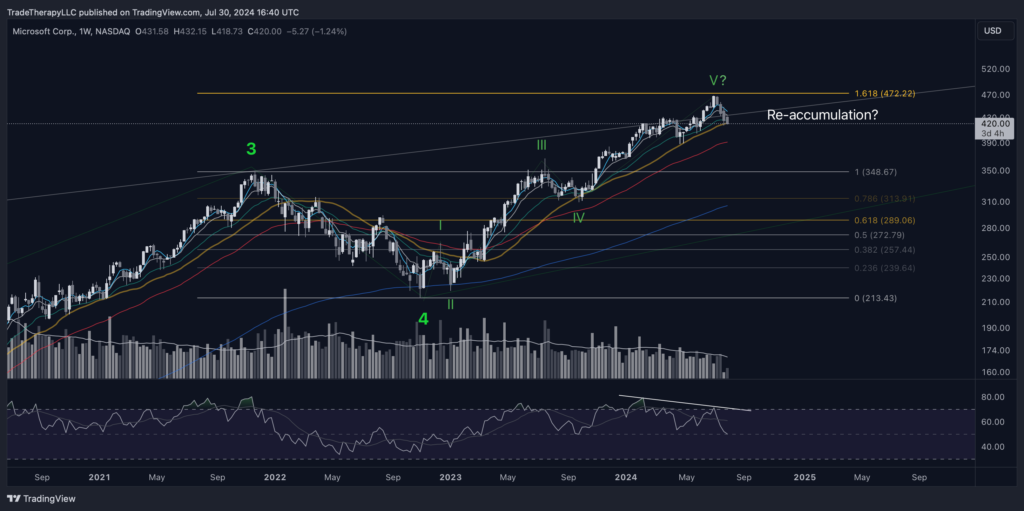
MSFT: Following a Similar Pattern
A similar pattern is evident in MSFT, where the stock also hit the 1.618 Fibonacci level. Currently, it’s holding above the 30-week simple moving average (30WSMA, gold), but this support will be tested, especially as we approach the FOMC meeting later this month. The bearish divergence we noted a month ago is starting to materialize, indicating that profit-taking and reallocation are underway.
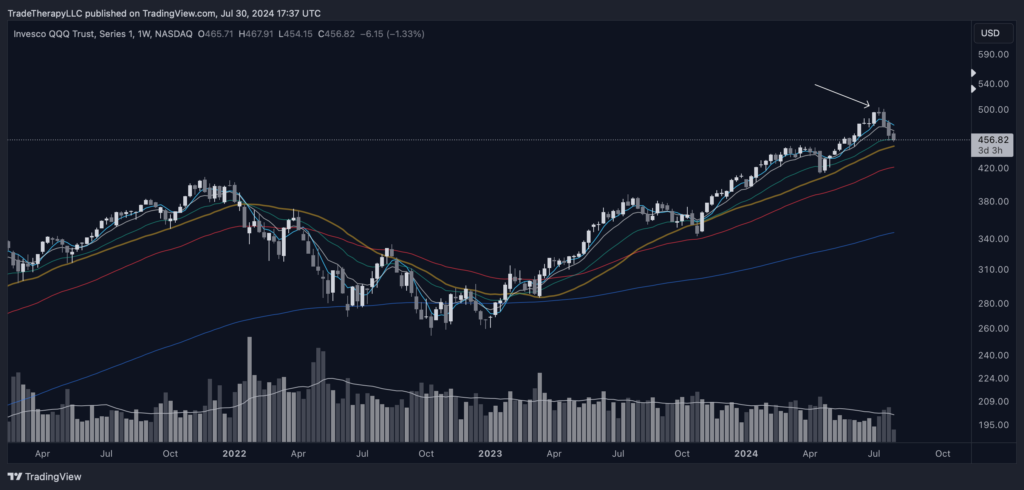
QQQ: The Broader Rotation in Action
The clean weekly chart for the Nasdaq 100 (QQQ) confirms that a broad rotation is occurring. We’ve been discussing this rotation happening ‘under the hood’ throughout the year, and now it’s on full display. This suggests that large institutional players are preparing to launch new markup campaigns in their newly acquired positions in sectors sensitive to interest rates. Their business relies on the retail investment community to provide liquidity. Bringing attention to their new positioning will provide that. The clear reversal candle on QQQ, with rising volume, signals that institutional investors are gearing up for the next phase. The 30WSMA may provide near-term support, but the potential for a retest of the 55-week exponential moving average (55WEMA) looms, especially with seasonal weakness approaching.
All three of these are great views of the business cycle from oversold in Oct.’23 to overbought earlier this month.
How is that affecting things?
We knew we had to make changes. It just never occurred to me that this would all happen so fast.
We finally got a significant move in CPI this month. Those that have been following along and/or have read our previous editions of FTTC most likely had a good idea this was coming. Last month, we did everything but forecast it. The writing has been on the wall for months. It’s difficult to determine how or why it’s taken so long for inflation numbers to come down.
The significant drop in CPI this month was expected by those who have been following our analysis, as we’ve been signaling it for months. Last month’s content all but forecasted this shift, and now the data is beginning to reflect those conclusions.
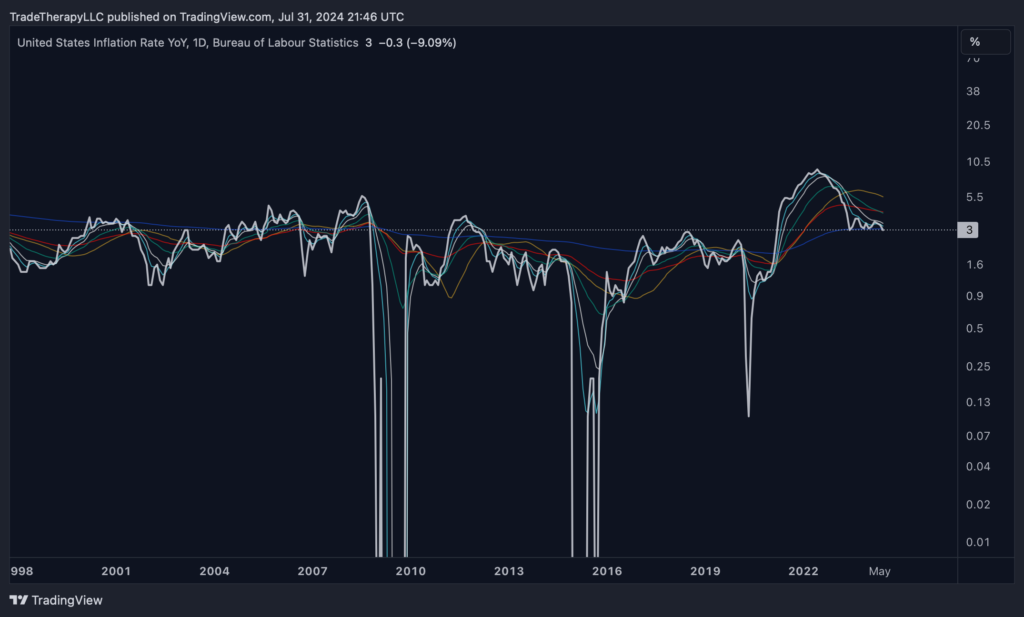
The year-over-year inflation rate is at its lowest in three years, suggesting that the volatile period of sharp rises and falls may be ending. All the key moving averages are now downward sloping, and we’re starting to see crossovers that could signal the end of this inflation cycle. This prolonged period of elevated inflation has given financial institutions ample time to quietly reposition their funds, shifting from sectors that thrived during high inflation to those poised to benefit as inflation cools. They’ve done this without drawing much attention, avoiding moves that could drive up prices and increase their costs.
This scenario highlights how larger players in the market control the timing of when the retail community becomes aware of their intentions. They only reveal their intentions once their positions are fully established and ready to benefit from retail-driven liquidity. It’s notable that these shifts are happening just as changes in monetary policy appear imminent.
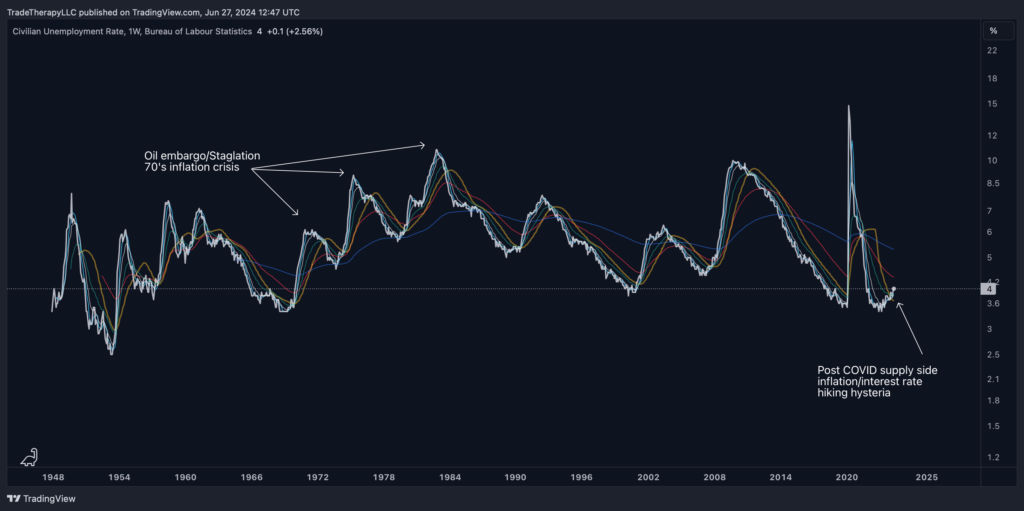
The Role of Employment and Federal Reserve Policy
Despite historically low levels, U.S. unemployment rates have been creeping up. Federal Reserve Chairman Jerome Powell commented during the June FOMC meeting that unemployment is expected to reach 4% by September and 4.2% by the end of the year, with the current rate at 4.1%, a sharp increase from last month.
The combination of rising unemployment and falling inflation should give the Federal Reserve ample justification to cut interest rates, although whether this happens in July or September remains uncertain. Previously, we were cautious about expecting rate cuts, but the clear rotation seen in July suggests that financial institutions are betting on rate cuts being imminent.
Navigating Seasonal Weakness and Election Year Challenges
As we approach the seasonal weakness we’ve previously discussed, it’s crucial to recognize that this is also an election year, adding an extra layer of complexity to the market landscape. Given the significance of the three-wave price cycles we analyzed last month, exercising caution during this period is advisable. We wouldn’t be surprised to see some unexpected market moves, offering institutions one last opportunity to bolster their positions. For instance, if Powell makes strong remarks at the upcoming FOMC meeting hinting at rate cuts in September, we could see favorable market conditions in August. However, if inflation unexpectedly rises and the Fed retreats from rate cuts in September, it could lead to a sharp decline in September and October. Keeping a longer-term perspective will be essential in navigating these potential fluctuations.
Yield Curve and Bond Market Developments
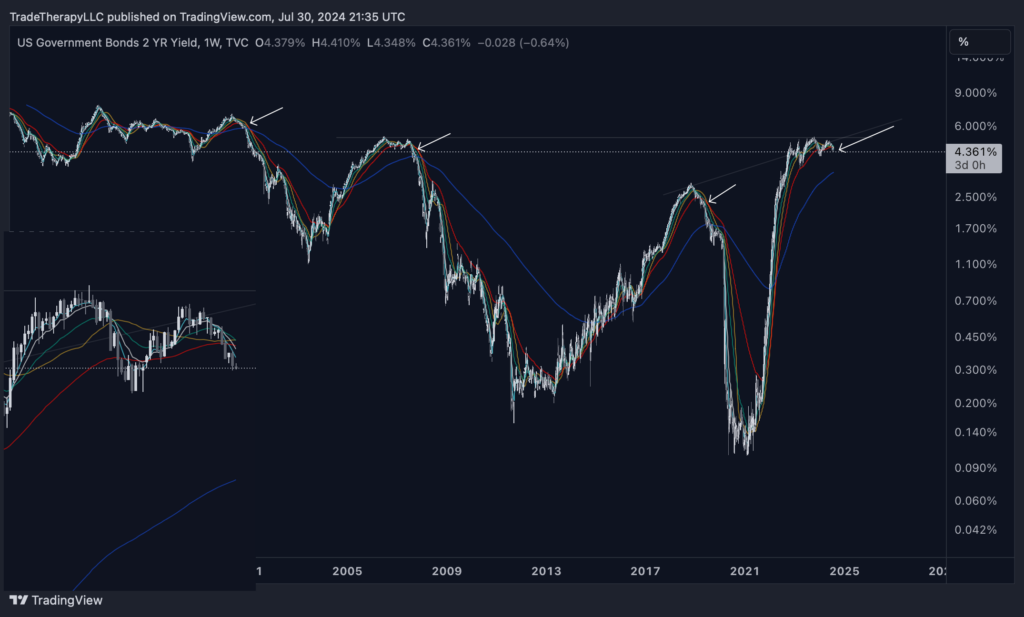
Over the past few months, we’ve discussed the bond market and the yield curve extensively. This is the ‘front end’ of the curve, specifically 2-year bond yields, where we’re seeing strong signs of normalization. This is a crucial development because a normalized yield curve is expected to unleash substantial capital flows back into the market from managed funds, which often have strict guidelines tied to the yield curve. The shift we’re observing now, with bond yields falling and prices rising, is a strong indicator that Wall Street is positioning for changes in monetary policy.
This is the weekly chart with the daily chart inserted in the lower left. The daily has now lost all of it’s moving averages with a long way down to the 200DEMA (blue). This is one of the most convincing signals that Wall Street is positioned and prepared for monetary policy change.
What can we work with?
I feel like big changes are coming. I’m just not sure if I’m ready.
In a striking development, the ‘Magnificent 7’ stocks have collectively lost over $2.6 trillion in market value over the past 20 days, a drop larger than the entire small-cap market. This movement underscores the magnitude of the rotation and the strategic shifts underway.
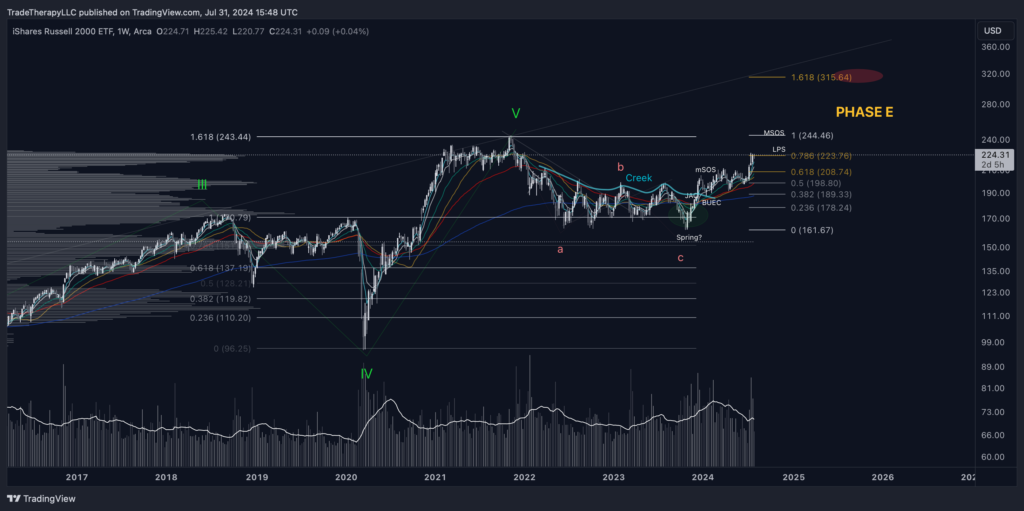
Russell 2000 Small Cap Index (IWM): A Breakout MomentWe’ve been closely watching the Russell 2000 Small Cap Index (IWM), noting the massive base that has formed from the pre-COVID re-accumulation period and the subsequent 2.5 years of accumulation. This month, IWM broke out on massive volume, pushing above the top of its range and on it’s way to setting a major sign of strength (MSOS). However, there’s still significant overhead supply at this level, particularly from the sideways trading period during 2021. Institutions often deal with such resistance by gapping over these trouble spots or using high volume to push through. The next few weeks will be crucial in determining whether IWM can maintain its breakout or if it will face resistance from retail investors looking to exit after years of holding losses.
iShares 20+ Year Treasury Bond ETF (TLT): Strategic Positioning
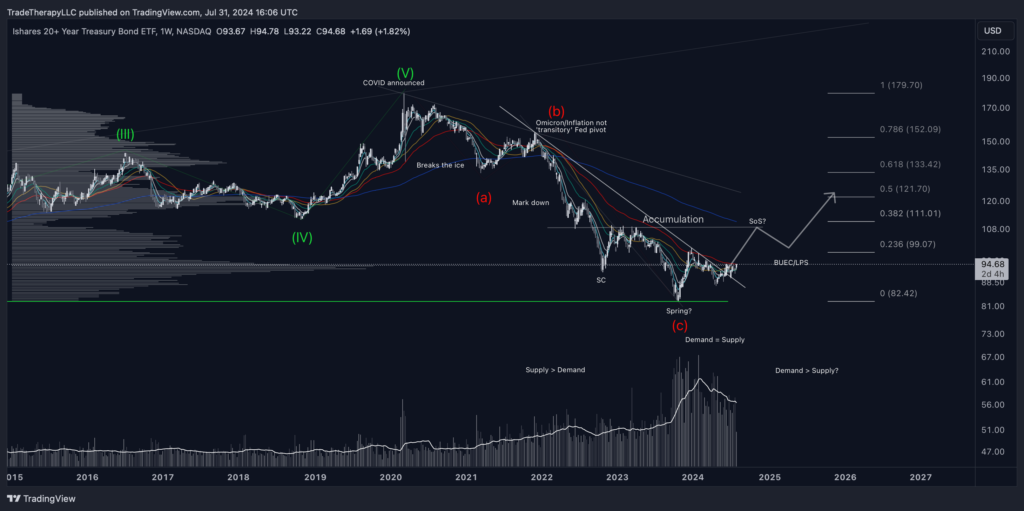
We originally shared this weekly view of iShares 20+ Year Treasury Bond ETF (TLT) in April. At the time we had this to say:
“Now that the accumulation process is well underway, don’t be surprised if we see a similar pivot occur at the ideal long entry point. Our speculative forward path reflects the setup as we move toward easing financial conditions. Expect to see a similar announcement somewhere near the backtest of the 30WSMA.”
This is the ‘long end’ end of the curve. Notice the weekly moving average cluster supporting price currently, including the 30WSMA (gold). Understanding the logic behind these moves—how the narrative is shaped to serve larger interests—gives us an edge in interpreting market signals. This is one of the most valuable lessons we have to share.
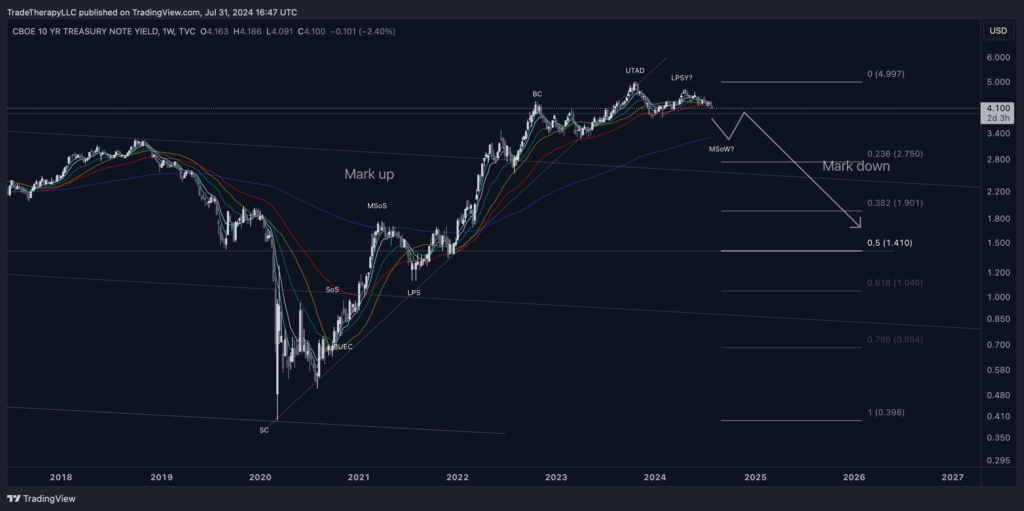
Final Yield Curve Considerations: The 10-Year Treasury Yield (TNX)
Our final look focuses on the 10-Year Treasury Yield (TNX), which represents the middle of the yield curve and is the last piece of the puzzle in the normalization process. TNX has lost all its weekly moving averages, which have clustered above it, creating strong resistance. For the yield curve to normalize, TNX must continue to decline, allowing yields to come down and prices to rise. This normalization is crucial for setting up the broader market for a sustained rally.
Trade Considerations: Strategic Moves for the Months Ahead
As part of our new format, we’re including a section for trades we’re considering based on the analysis provided. It’s important to note that these are not recommendations or financial advice, but rather insights into potential opportunities we’re exploring for our clients and ourselves.
- Yield Curve Normalization: We’re heavily focused on opportunities related to the normalization of the yield curve, including long positions in TMF (3x Bull ETF for TLT) and potentially IEF (7-10 Year Bond ETF). These high-conviction trades are rare and present significant upside potential.
- Small Cap Opportunities: We continue to see value in IWM and its leveraged ETF counterpart, TNA, especially if the index can navigate the overhead supply and establish a new uptrend.
Final Thoughts
This month’s edition of FTTC was written prior to the Federal Reserve announcement on July 31st. Assuming all goes according to plan and rate cuts are referenced for September, there should be a strong reaction in the markets over the next several weeks. It is critical that everyone be aware of seasonality and the upcoming volatility expected.
There will also likely be a flurry of ‘hot takes’ circulating in the fintwit universe from macro bros claiming that rate cuts lead to recessions. This is simply not the case. If you’ve been keeping up with Trade Therapy content, you realize by now that these narratives all have a purpose in mind when they’re created. We do expect to see a low in October and really scary headlines should be expected.
Disclaimer: Trade Therapy, L.L.C. content is intended for US recipients only and is not directed at UK recipients. Our information and analysis do not constitute an offer or solicitation to buy any security and are not intended as investment advice. Content should be used alongside thorough due diligence and other sources. Opinions and analyses are those of the author at the time of publication and may change without notice. Trade Therapy, L.L.C. and its employees may move in or out of any trades detailed within our content at any time at their discretion. Employees and affiliates of companies mentioned may be customers of Trade Therapy, L.L.C. We strive for transparency and independence, and we believe our material does not present a conflict of interest. All content is for educational purposes only.
Leave a Comment
You must be logged in to post a comment.