
August has a way of humbling traders. The calendar itself works against momentum: volumes thin, liquidity dries up, and the air feels heavy. These are the dog days of the market — the stretch of late summer where exhaustion sets in, campaigns stall, and institutions quietly manage their risk while retail questions whether the game has changed.
This month we’re looking at how that seasonal heat is showing up across the institutional cycle. From the backtests in small caps, to the narrowing breadth in the majors, to the subtle but steady shift in monetary policy expectations, the message is clear. Risk isn’t being abandoned, it’s being rationed. The campaigns of 2023–24 aren’t collapsing, they’re maturing, and Wall Street is making sure to lock in gains before the weather turns.
That doesn’t mean September will be smooth. Historically, late summer into early fall has delivered some of the nastiest volatility spikes of the year. But so far, this season’s chop has been more about testing demand than breaking it. The dog days remind us: when the market looks sluggish and unconvincing, it’s often just the professionals stepping back, letting retail sweat it out before setting up the next decisive move.
Institutional Business Cycle – The Dog Days
“I thought summer was supposed to be easy. Instead, every time I try to add risk, it feels like the market just slumps over in the heat. Is this exhaustion, or the start of something worse?”
Welcome to the dog days of August — a stretch of the calendar that has historically delivered more chop than cheer. Thin liquidity, stretched campaigns, and managers heading for the beach tend to produce sloppy price action that feels like exhaustion more than conviction.
But make no mistake: institutions are not dozing off. They’re using the heat to manage risk. Overextended leaders have seen profit-taking, not panic; breadth has narrowed, but the indices haven’t cracked. In Wyckoff terms, this is a backtest phase, not a markdown. Demand is being checked, liquidity is being gauged, and September’s cooler air will determine whether campaigns reset for another run or roll into a more serious correction.
Retail feels frustrated because rallies look half-hearted and dips lack follow-through. But that’s exactly the point — this is a market in distribution testing its buyers. The message shows up most clearly in small caps. While SPY and QQQ grind on the backs of a few mega-caps, IWM has spent August backtesting demand zones instead of making new highs. That divergence is the institutional tell: liquidity is being rationed, not expanded, and risk appetites are cooling with the summer air.
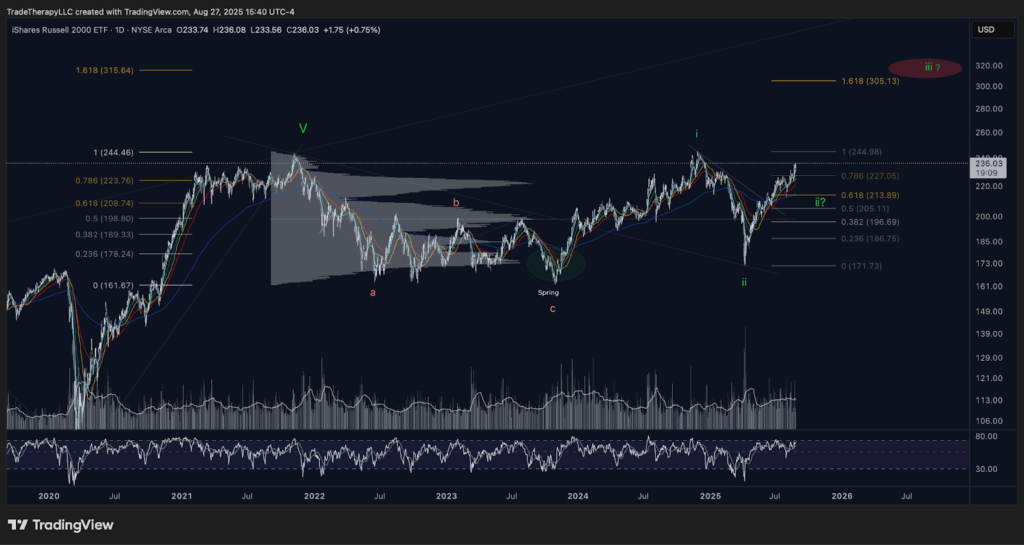
📊 Chart 1 – IWM (August 2025): Seasonal Backtest in the Dog Days
Small caps slip into a demand retest while indices hold up, showing institutions testing liquidity rather than committing fresh capital.
The rotation underneath the surface confirms this isn’t a broad collapse of demand but a recalibration of risk. Wall Street has been quietly trimming exposure in the recent high-flyers — names like HOOD, PLTR, and OKLO that carried momentum through the first half of the year. Those campaigns aren’t being abandoned so much as harvested. Institutions are booking profits where valuations stretched and redirecting capital toward interest-rate sensitive laggards that are finally finding air as the policy backdrop softens.
Emerging markets and select small- to mid-cap groups, many of which were punished during the inflation hysteria of 2022, are starting to attract fresh flows. These are the “late bloomers” of the cycle: companies that weren’t first in line during the initial markup but now benefit from the cooling macro environment. It’s a rotation pattern that speaks directly to institutional discipline: take gains from crowded winners, recycle capital into discounted areas with asymmetry, and keep portfolios balanced as the season turns.
This is why IWM’s backtest matters. Small- and mid-cap segments have become the proving ground for whether this rotation has legs. If demand holds in these areas, it allows institutions to sustain broader campaigns even as leadership changes hands. If it doesn’t, then the majors will be left carrying the burden on thinner breadth.
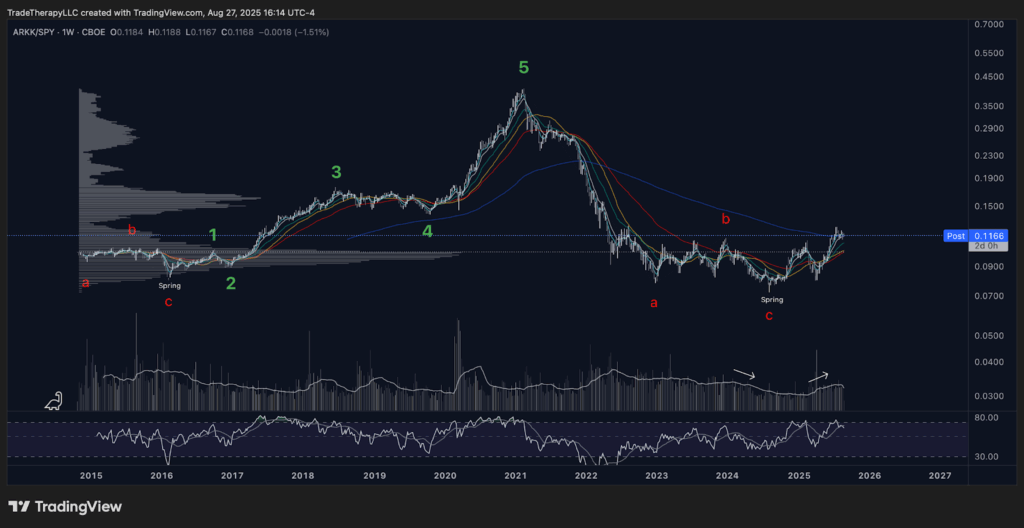
📊 Chart 2 – ARKK/SPY (August 2025): Institutional Rotation Confirmed
An enormous volume base signals heavy institutional accumulation during the “inflation threat.” With policy shifting, the ratio breaks higher, confirming the next leg of growth-to-benchmark rotation.
The scale of this base leaves no doubt about institutional intent. The volume profile shows a massive foundation built through 2022–23, an accumulation phase disguised as “inflation hysteria.” It’s no coincidence. Wall Street leaned into the restrictive monetary backdrop, absorbing growth assets at discounted prices while the narrative kept retail sidelined.
Now the ratio has broken higher, supported by stacked moving averages and expanding volume. That shift is not retail enthusiasm — it’s institutions repositioning for the next markup cycle. Each spring and retest along the way confirms how deliberately this base was defended. What looks like a long, frustrating grind to retail is in fact a carefully engineered launchpad for outperformance.
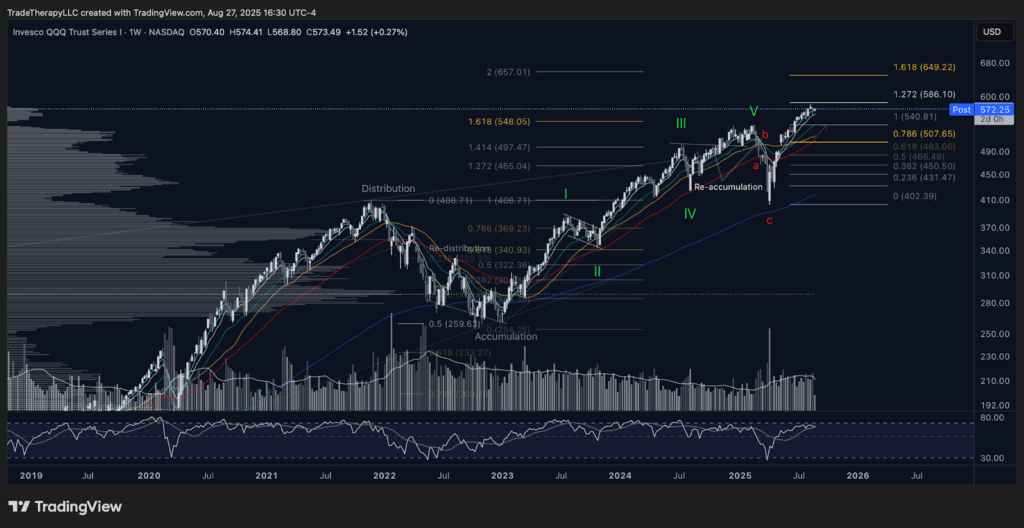
📊 Chart 3 – QQQ (August 2025): Testing Phase After Absorption Flush
After reclaiming its moving averages with one of the sharpest rallies on record, QQQ now faces unfinished business below. Institutions are likely to probe inefficiencies before committing to the next markup leg.
The Nasdaq has been the real stress test for this entire cycle. QQQ, more than any other index, reflects how institutions balance leadership and liquidity when sentiment runs hot. Back in December, the euphoric breakout into the 1.618 Fibonacci extension told us what was coming: not a fresh markup, but profit-taking into overextended conditions. By April, the controlled flush to the 200-week EMA validated that playbook. Institutions absorbed supply, tested demand, and reclaimed the structure almost immediately.
That bounce was one of the sharpest in QQQ’s history—not in size, but in velocity and intent. It wasn’t retail enthusiasm. It was a coordinated defense of long-term positioning, clearing shorts and setting the stage for the next campaign. But that kind of rally is rarely final. In Wyckoff terms, it’s a provocation. A way to see who is left standing on the short side before markup truly begins.
Which is why the unfilled gap between $501 and $484 matters so much. In the dog days of summer, these inefficiencies often get revisited under the cover of seasonal chop. If the zone holds, institutions can press forward with confidence. If it doesn’t, the range expands and the testing continues. Either way, QQQ is behaving exactly as the institutional roadmap suggested: first the absorption flush, then the provocation rally, and now the testing phase that will determine when full-scale markup resumes.
Taken together, these moves show us exactly where we are in the institutional cycle. The broad accumulation work of 2022–23 is complete, and the markup campaigns of 2023–24 have matured. We’re not in a fresh expansion, nor are we in collapse — we’re in the management phase. Institutions are trimming extended winners, recycling capital into late bloomers, and stress-testing demand through controlled volatility.
IWM’s backtest shows that small caps are being used as the proving ground. ARKK/SPY confirms that growth rotation is underway, built on the enormous base Wall Street accumulated while retail was scared off by inflation headlines. And QQQ demonstrates how volatility is deployed as a weapon: flush the tape when conditions allow, absorb on the lows, then rocket price back up to resume the trajectory.
This is distribution, but not the terminal kind. It’s the measured, calculated version that resets campaigns, clears excess sentiment, and positions institutions for the next markup when policy and liquidity turn more favorable. The dog days remind us that what looks like exhaustion to retail is really just the pause phase of the business cycle — where the professionals take profits, test demand, and quietly prepare the next leg.
💡 What This Means To You
Seasonal chop isn’t weakness — it’s how institutions manage risk. The dog days of August are designed to test demand, trim extended winners, and rotate into new leadership. For you, the lesson is to resist the urge to chase what’s been working and instead watch where liquidity is quietly building. Small- and mid-caps, along with rotation ratios like ARKK/SPY, reveal where the next campaigns are forming. Treat August’s backtests as signals, not setbacks.
Monetary Policy – Cooling Shade or Mirage?
“Rates are finally coming down, right? That should be a good thing for markets. So why does it still feel like I’m sweating every time Powell speaks?”
The dog days of August don’t just exhaust traders — they expose the way policy shifts get weaponized by institutions. For nearly three years, “higher for longer” was the drumbeat. Every Fed presser, every CPI print, every bond auction became an excuse for headlines to scream risk. Retail internalized it. But institutions treated it as cover. The longer the restrictive tone dragged on, the more opportunities they had to engineer shakeouts, forcing late buyers out of their positions and quietly absorbing supply at wholesale.
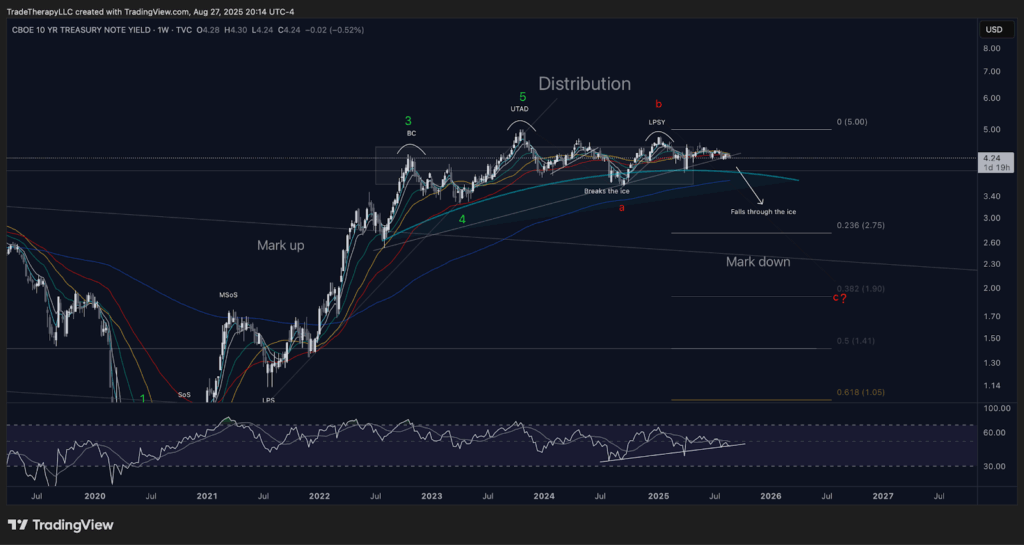
📊 Chart 4 – TNX (August 2025): The Policy Lever in Action
Each surge in yields coincided with forced selling in equities and crypto. What looked like a macro inevitability was in fact an engineered execution tool for institutions to clear the tape.
TNX, the 10-year yield, spent most of the cycle grinding relentlessly higher. But each surge wasn’t just a macro story — it was a tactic. Every spike coincided with forced selling in equities, crypto, and even Treasuries themselves. And then, just as the panic peaked, yields stalled. The final spike cleared the deck, exhausting the “inflation forever” narrative and leaving institutions sitting on the other side of the trade.
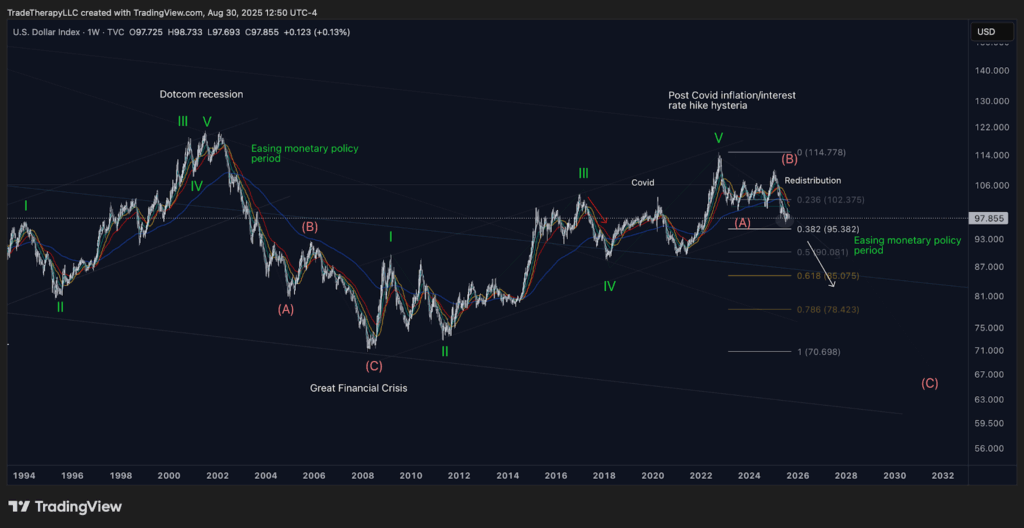
📊 Chart 5 – DXY (August 2025): Restrictive Peaks, Engineered Fear
The dollar’s climb through 2023–24 pressured global liquidity, but its rollover in 2025 confirmed that institutions had been accumulating into weakness the entire time.
The dollar followed the same playbook. DXY pressed to restrictive peaks through 2023–24, driving global deleveraging and punishing anything tied to liquidity. Emerging markets, growth sectors, even commodities bent under its weight. But the stronger the dollar climbed, the more it set up for an eventual rollover — and that turn is exactly what we’ve started to see in 2025. A softening dollar doesn’t just ease conditions abroad, it confirms that Wall Street had been laying in bids all along, waiting for the cover of policy pressure to break.
Disclosure: No current position in TMF
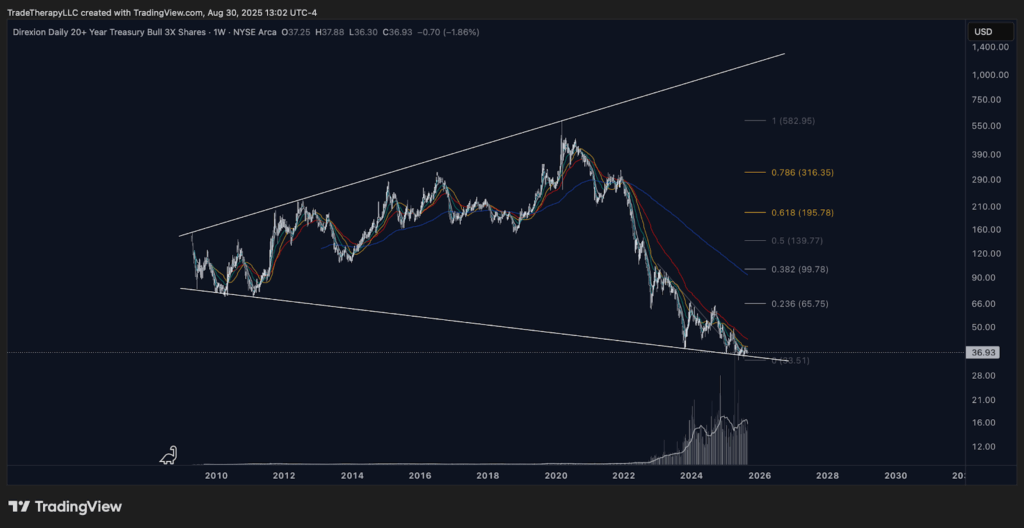
📊 Chart 6 – TMF (2009–2025): The Long Game in Long Duration
Fifteen years of swings compressed into a single structure, ending with a violent flush into record absorption. The volume tells the story — institutions were loading size while the headlines screamed “higher for longer.”
This is the chart the “recessionistas” never want to answer to. So… are they really saying bonds are going to break down from here? After a decade-long wedge, after record absorption volume, after a violent spring that institutions clearly defended? That’s the bet they’d have to make. And if they can’t answer it, the market already has.
This isn’t collapse. It’s preparation.
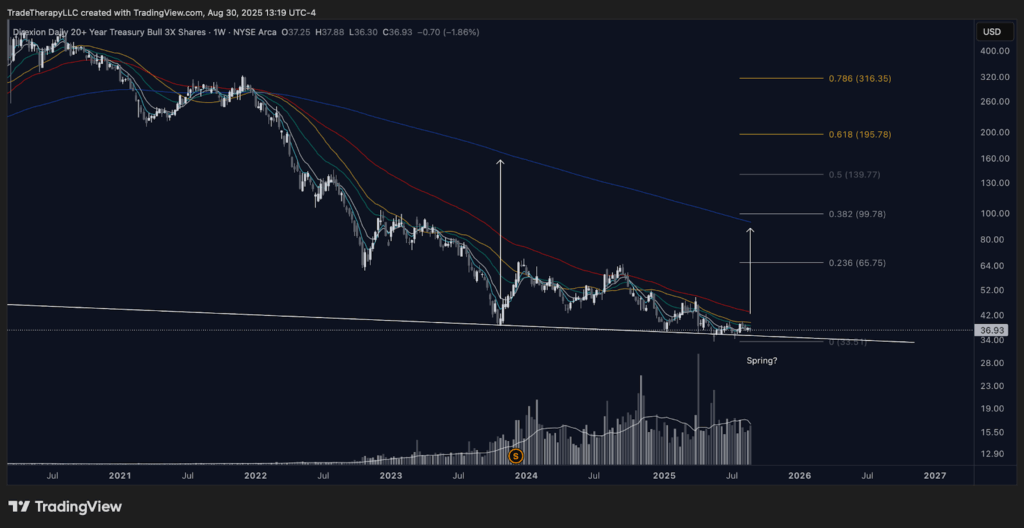
📊 Chart 7 – TMF (2022–2025 Weekly): Wyckoff Spring in Motion
Zooming in reveals the tactical play: potential extension below the demand line to complete a Wyckoff Spring. The signal isn’t in the dip — it’s in the extension away from the 200WEMA that follows, marking one of the highest-probability trades in the market today.
No chart cements the continuation of the secular bull market in interest rate–sensitive sectors more than this one. The base is built, the absorption is clear, and the spring setup is in place. When it extends away from the 200WEMA, the confirmation will be unmistakable: the next markup phase in long duration has begun.
📚 Institutional Literacy: Policy as Cover
When the Fed says “higher for longer,” retail hears doom. Institutions hear opportunity. Restrictive policy provides the perfect excuse to trigger late-stage shakeouts in assets that have already built strong bases. By leaning into the narrative, professionals can flush out weak hands and accumulate size while sentiment is darkest.
This is why interest rate–sensitive sectors — small caps, emerging markets, long-duration bonds — built such enormous bases through 2022–23. The headlines weren’t lying about pressure; they were disguising accumulation. What looks like chaos to retail is just the cycle at work: shakeouts first, markup later.
If you ever doubted the scale of Wall Street’s influence, look no further than TNX. The persistence of yields this high, for this long, isn’t just a reflection of macro forces — it’s the byproduct of immense institutional control. Watching it unfold has been both impressive in its precision and sobering in its implications. But for us as traders, the point isn’t to judge it. It’s to recognize it for what it is: the cycle at work. Nothing moves until the largest players allow it, and when they do, the next phase unfolds with mechanical inevitability.
💡 What This Means To You
The policy cycle isn’t chaos — it’s engineered volatility that professionals use to their advantage. Retail sees “higher for longer” as a reason to panic; institutions see it as cover to buy fear and reset positioning. For you, the lesson is simple: don’t react to the headline move. Watch how yields, the dollar, and leveraged Treasuries behave at these inflection points. The highest-probability trades come not from predicting the Fed, but from recognizing when supply has been exhausted and institutions are already positioned for the next phase.
Supply vs. Demand – The Next Phase Unfolds
“Every dip feels like a trap. If I sell, it runs away without me. If I chase, it reverses the next day. How am I supposed to know where the real demand is?”
Emerging markets, financials, and mid-caps together confirm the next phase of the institutional cycle. These sectors were among the hardest hit during the tightening campaign, and they also built some of the deepest bases. What looked like endless pressure in 2022–2023 was in fact absorption. What felt like exhausting chop in 2024 was deliberate testing. Now, each is showing the same story: supply has been cleared, demand is asserting itself, and markup is quietly beginning.
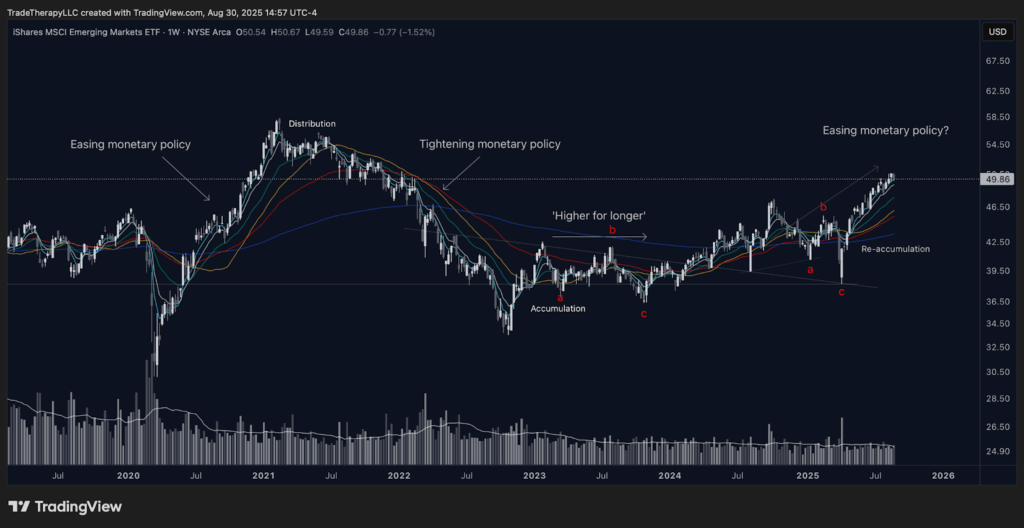
In emerging markets, the cycle is unmistakable. Distribution under easy policy in 2021 gave way to a punishing markdown during tightening. The “higher for longer” phase of 2023 produced an extended accumulation base, defended through every attempt to break lower. By mid-2024, re-accumulation was clear, and in 2025 EEM finally broke higher as the dollar eased and yields stalled. Institutions absorbed into fear, defended the range, and are now pressing their advantage.
Disclosure: No current position in EEM
📊 Chart 8 – EEM (August 2025): From Policy Pressure to Breakout
Accumulation under the cover of “higher for longer” is now resolving into markup. The breakout in emerging markets confirms that institutions rotated in long before policy officially turned.
Financials tell the same story from a different angle. XLF spent nearly two years compressed beneath supply, pinned down by yield pressure and curve inversion. Yet instead of breaking, that compression acted as a coiled spring. Institutions defended long-term demand, reloaded positions, and waited. Now, as policy pressure eases, XLF has punched through its supply zone and is pressing into new expansion levels. Banks and insurers thrive when liquidity shifts back in their favor, and the chart shows clearly that institutions anticipated this turn months before retail caught on.
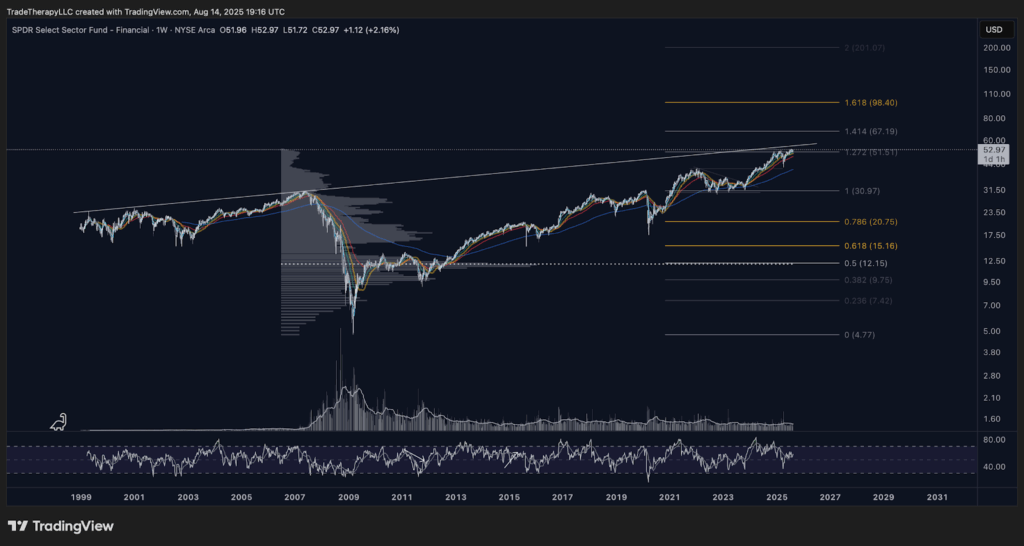
📊 Chart 9 – XLF (August 2025): Compression Resolves Higher
Financials push through supply after two years of re-accumulation, confirming that institutions rotated into banks and insurers ahead of easing liquidity.
Small- and mid-caps are the most interest rate–sensitive corner of the equity market. IWM’s August backtest showed institutions probing demand, and now mid-cap indices are beginning to firm as well. These groups were crushed during the inflation hysteria of 2022, yet that punishment created deep bases with asymmetry. Institutions know it, and the early rotations here suggest that the next phase of the bull market will be carried not by mega-cap extensions but by the late bloomers finally allowed to run.
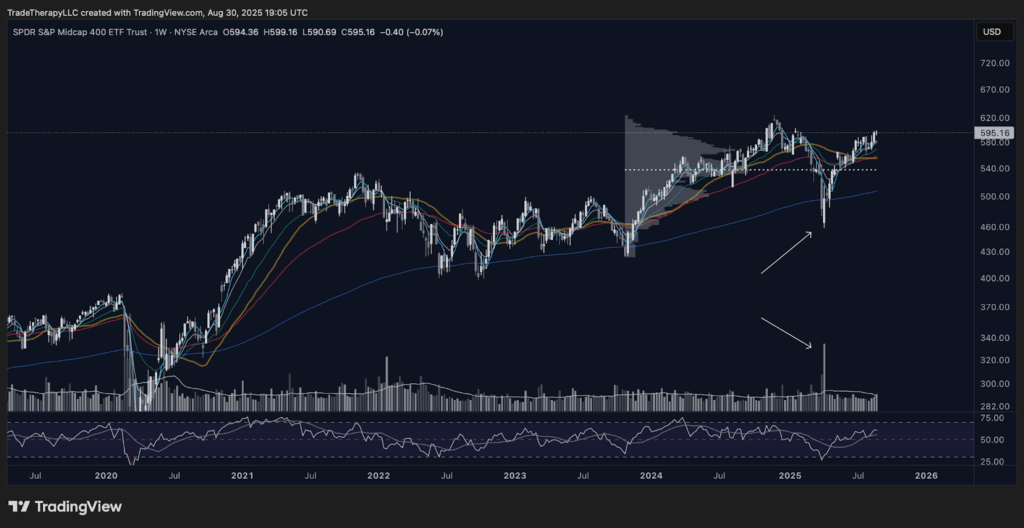
📊 Chart 10 – MDY (August 2025): Late Bloomers Awakening
Mid-caps emerge from long-term bases, confirming rotation into the most rate-sensitive equities as policy pressure eases.
The short-term view remains one of caution. Backtests, shakeouts, and controlled volatility are still in play, especially in August and September. The long-term view, however, is unmistakable. The foundations of the next markup are already in place. Emerging markets have broken from their bases, financials are turning compression into expansion, and mid-caps are awakening from years of policy-driven suppression. Institutions are not exiting, they are rotating.
Robinhood (HOOD) is a perfect example of how the market punishes first, then rewards later. In 2022, the inflation hysteria and tightening cycle obliterated retail brokers, leaving HOOD deeply discounted and widely dismissed. While sentiment wrote it off, institutions quietly accumulated a multi-year base. That absorption has now paid off. In 2025, HOOD has emerged as a rotation beneficiary, moving sharply off its demand range just as policy pressure begins to ease. The supply and demand profile shows higher lows, expanding volume, and constructive moving average alignment. This is a classic setup that retail often mistakes as “too late,” when in fact it is the early innings of markup.
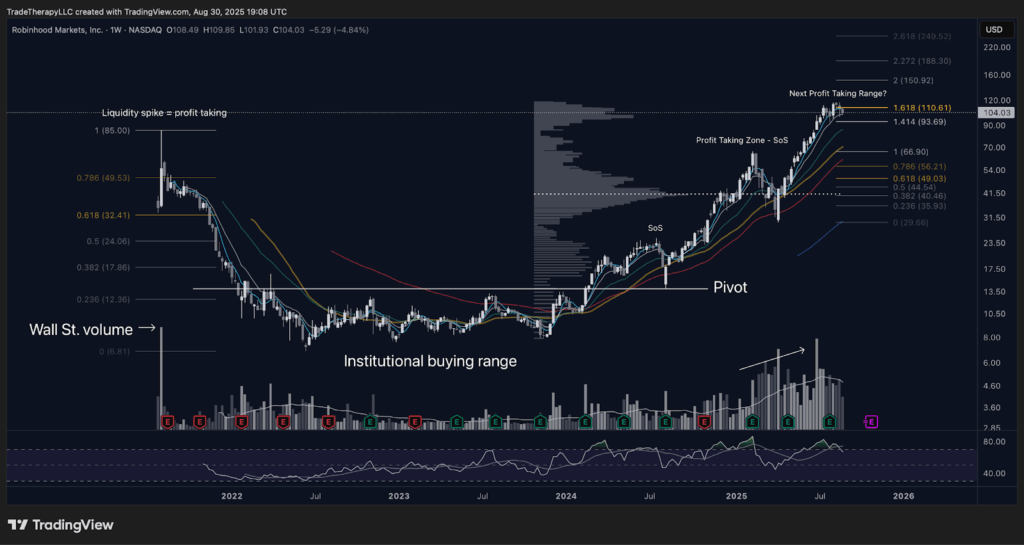
📊 Chart 11 – HOOD (August 2025): From Punishment to Payoff
Multi-year base resolves higher as volume expands and institutions rotate into retail finance just as policy pressure lifts.
OKLO tells the story of speculative capital being recycled into innovation themes. As a small-cap nuclear innovator, it was buried during the tightening phase when anything high-duration was indiscriminately sold. Institutions did not abandon it. They accumulated through the weakness, defending its range while the narrative kept retail on the sidelines. Now, with the policy cycle turning and capital rotation favoring asymmetry, OKLO has exploded higher. Its breakout was not a retail-led squeeze. It was the release of accumulated inventory into markup conditions.
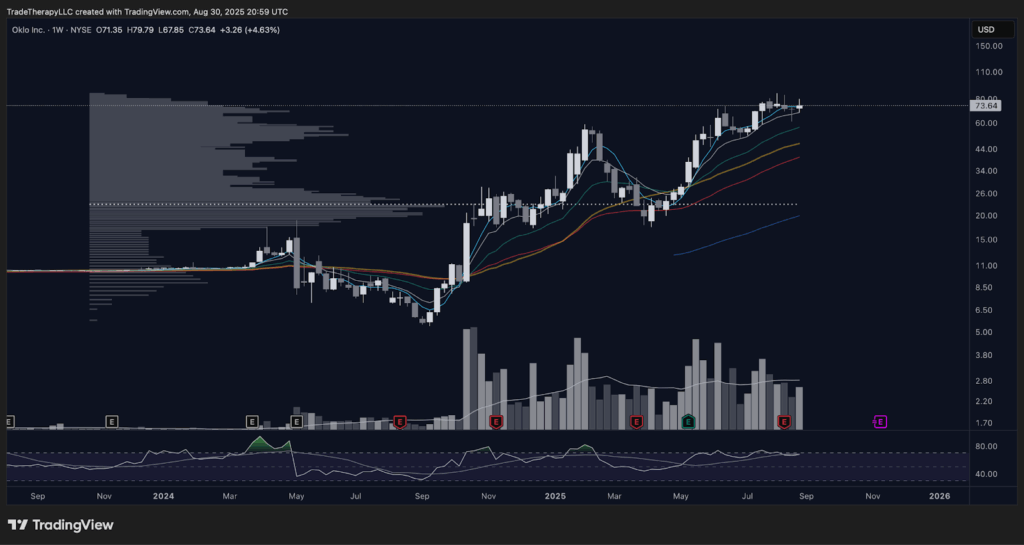
📊 Chart 12 – OKLO (August 2025): Innovation Breakout Fueled by Accumulation
Speculative innovation transitions from defended base to markup, confirming institutional rotation into late bloomers with asymmetric upside.
These case studies reinforce the broader message. Short-term volatility may feel punishing, but the long-term roadmap is intact. Institutions use the dog days to shake out weak hands, then redeploy into the assets that benefit most from easing liquidity. HOOD and OKLO are not anomalies, they are evidence that the next phase of the cycle is already underway.
💡 What This Means To You
Supply and demand imbalances do not just apply to tickers like SPY or QQQ. They are visible in the very names most traders overlook. HOOD and OKLO show what happens when deep bases collide with easing conditions: explosive upside. For you, the takeaway is clear. Do not mistake late bloomers for laggards. They are often where the highest asymmetry lies once institutions recycle capital.
Final Thoughts – Trading Through the Dog Days
August reminds us that markets are never about comfort. Thin liquidity and seasonal chop tempt traders into mistakes, whether by chasing shallow rallies or panicking on engineered flushes. Institutions, by contrast, use this stretch to manage risk, rotate capital, and prepare for the next campaign.
The institutional business cycle section showed how small caps and rotation ratios like ARKK/SPY confirm this is a management phase, not a collapse. Monetary policy revealed how “higher for longer” was cover for engineered shakeouts, producing some of the largest absorption bases in years. And supply versus demand made it clear that the very sectors and names punished by that policy cycle are now leading as pressure eases.
The message is consistent: short-term stress tests are still in play, but the long-term roadmap is intact. Late bloomers are breaking higher, emerging markets are waking up, and financials are expanding out of compression. These are not accidents. They are the footprints of institutional positioning.
“So what do I do in the meantime?” you might ask. The answer is the same as it always is: manage risk, respect the cycle, and remember that volatility is not the enemy. The dog days will pass, but the roadmap remains.
Want the deeper dive?
FTTC is free because we want traders thinking bigger, but Clarity is where we map every move with precision. Every week, Clarity zeroes in on a featured spotlight ticker, builds a top‑down view of the broader market, rotating roughly 35-50 stocks, ETFs, crypto, and indices in total.
This week marks the 61st edition — more than sixty straight weeks of institutional‑grade analysis built for traders who want to trade the cycle, not the headlines.
👉 Check out Clarity here — and start trading the cycle with the same patience and intent as the institutions who control it.
Disclaimer: Trade Therapy, L.L.C. content is intended for US recipients only. Our information and analysis do not constitute an offer or solicitation to buy any security and are not intended as investment advice. Content should be used alongside thorough due diligence and other sources. Opinions and analyses are those of the author at the time of publication and may change without notice. Trade Therapy, L.L.C. and its employees may move in or out of any trades detailed within our content at any time at their discretion. Employees and affiliates of companies mentioned may be customers of Trade Therapy, L.L.C. We strive for transparency and independence, and we believe our material does not present a conflict of interest. All content is for educational purposes only.
Headlines used for educational analysis under fair use; all rights reserved by original publishers