
What’s goin’ on?
Everything seemed to be going great. We really made some good strides. Then everything ground to a halt and we seem to be moving backwards. I just don’t know what to make of it.
Fed’s Rate Cuts and Market Response: An Unexpected Reaction
A little over a month ago, the U.S. Federal Reserve Board finally cut interest rates. All year in From The Trading Couch(FTTC), we’ve discussed upcoming policy changes and examined interest rate-sensitive sectors, bond yields, and the U.S. dollar (USD). We reviewed different cycles to gauge what to expect moving forward. Now that rates have been cut, why aren’t markets reacting as expected? Why are mortgage rates rising? Is it different this time?
Indeed, we’ve seen the USD spike, with short-term bond yields pushing higher—unusual following a rate cut. For anyone following headlines, the messaging may seem unclear: Did the Fed cut too much, or did it act too late? It’s a question that’s on many minds and exactly why From The Trading Couch exists.
Institutional Influence on Market Reactions
Throughout the year, we’ve examined how large players control interest rate-sensitive markets, suppressing some sectors while accumulating others. This section of FTTC focuses on the institutional business model, focusing on inflation-sensitive and interest rate-sensitive sectors. Many assets that have been under heavy accumulation appear unaffected by the recent rate cut, leaving retail investors to wonder: Is it Wall Street’s doing?

All year, we’ve discussed strategies employed to take advantage of retail investors at market cycle extremes. This period, more than ever, reflects these tactics, as Wall Street exhausts every means to retain control of key sectors. Between late October and mid-November, we anticipate volatility as institutional players push the extremes, urging retail investors to buy at highs or sell at lows—right before the big trend shift. It’s late October, before a highly contested Presidential election and just after the first rate cut. What would you expect?
One of the main themes throughout Trade Therapy content is large, financial institutions are what moves the markets. The rest is just journalism. We consistently reference examples of how larger operators leverage their seemingly unlimited resources to have their way with retail investors. Whether they’re propagating false narratives or temporarily manipulating the supply v. demand condition, Wall St. always wins. We often say, institutions don’t want retail investors in their trades until they’re ready to take profit. Let’s consider what has transpired in the S&P 500 over the past few years.
Institutional Tactics in Action: Case Study of the S&P 500
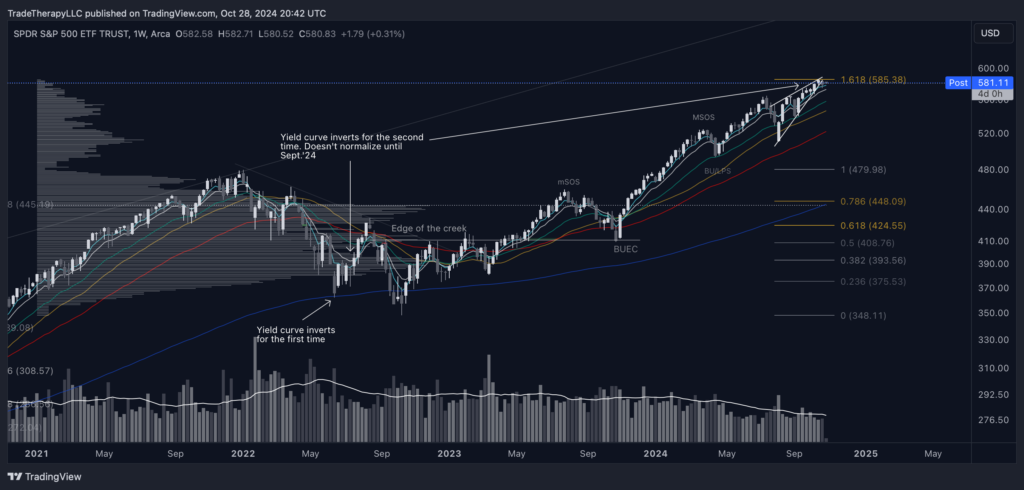
In the post-COVID correction, recession predictions grew loud as the S&P 500 plunged and the yield curve inverted, signaling a downturn to come. Wall Street moved in the opposite direction, though; without recessionary indicators in the underlying data, institutions seized opportunities during the October 2023 panic, buying low and later reaping profits as the S&P 500 surged, surpassing pre-COVID highs and reaching profit-taking levels at the 1.618 Fibonacci extension.
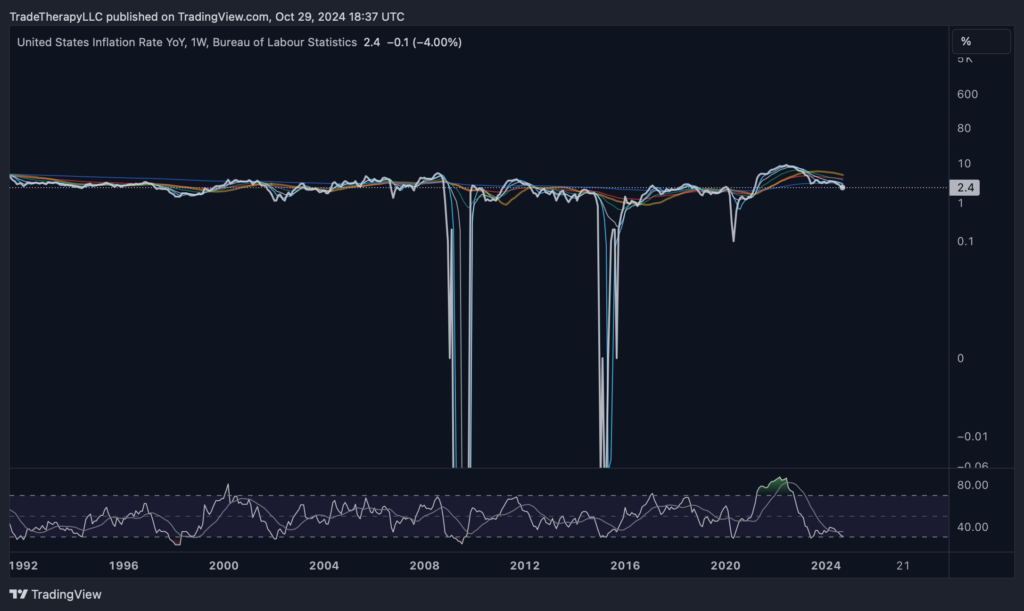
Despite 12 consecutive months of falling inflation, the Fed held rates high, citing potential future inflation risks. As media sensationalized recession fears, Wall Street executed a markup campaign. This pattern underscores the importance of data literacy over media narratives: yield curve inversions aligned precisely with market lows—more than a coincidence.
The good news is the ongoing inflation problem has been addressed and the calls for an imminent recession have subsided. It’s time for retail investors to come back to the markets as rates are dropping which is good for the stock market! Just in time for Wall St. to take profits at the 1.618 fibonacci extension and, again, retail investors provide the liquidity. The story as old as time itself repeats and the institutional business cycle rolls on.
Now do you see why we’ve been talking about rotation out of the S&P 500?
The Road Ahead for the S&P 500: A Temporary Pullback?
We’re not suggesting the S&P 500 is approaching another deep, corrective period. As we’ve been covering for the past several months, this should be a re-accumulation period. Nothing extensive or long lasting, but deep enough to stop out the recently attracted retail community enabling professional money to reacquire their positions to begin the process all over again.
How is that affecting things?
We were told things were going to change but it looks like more of the same. The new things we’re trying aren’t working. I guess it’s time to consider giving up and going back to our old ways.
Despite the anticipated rate cuts, markets seem largely unchanged. Retail investors may be frustrated by the apparent lack of impact, but history suggests Wall Street institutions are simply not ready to release control of these sectors just yet. Remember, deception is Wall Street’s specialty.
U.S. Dollar Index (DXY) and Its Market Impact
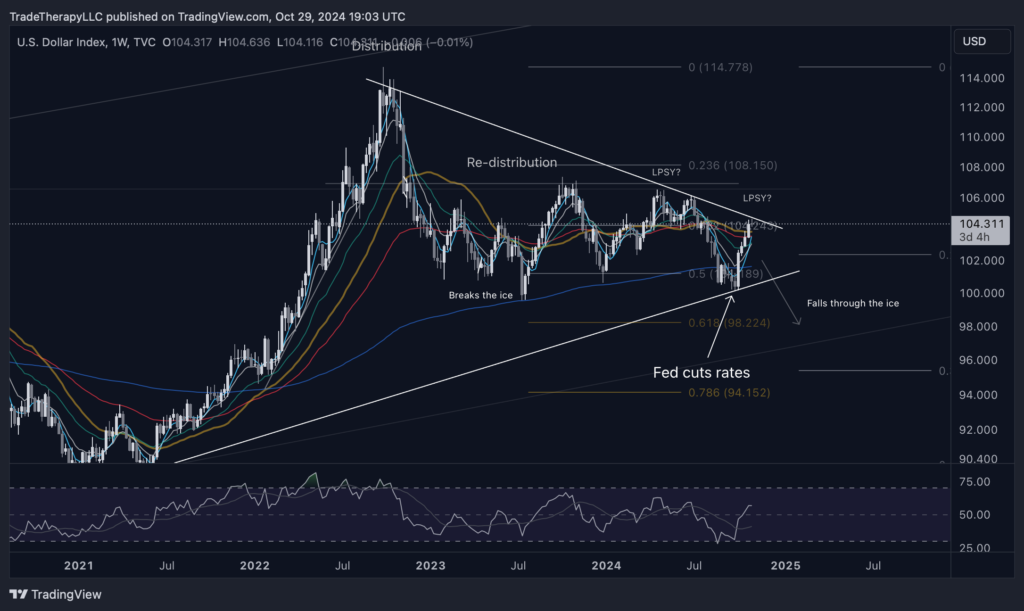
All year, we have tracked the impacts of a strong USD on equity markets, with U.S. Dollar Index (DXY) movements closely tied to inflation and Federal Open Market Committee (FOMC) meetings. Major events like the Consumer Price Index (CPI) and FOMC announcements trigger volatility, which institutions use to build positions and trade ranges.
The post-cut DXY reaction suggests Wall Street is capitalizing on seasonal and election-related volatility. With more cuts likely after the election and upcoming FOMC meeting, the economics of lower rates and a strong dollar are clashing. In the meantime, financial institutions are testing market reactions in recently accumulated positions.
Treasury Bond Yields and Wall Street’s Hidden Agenda
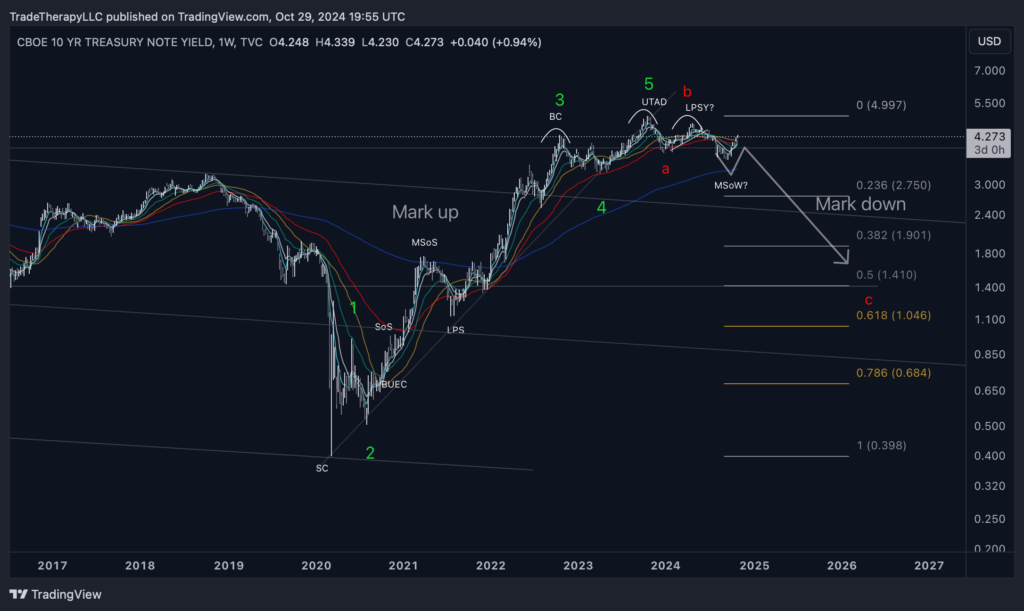
Examining the 10-year Treasury Note yield (TNX) confirms our forecast for volatility. Yields remain high, which keeps interest rate-sensitive sectors suppressed. This behavior discourages retail entry until institutions are ready to take profits, ultimately setting the stage for a “jump across the creek” (JAC) move. Wall Street’s playbook continues to highlight their goal to control retail behaviors.
U.S. 2-Year Bond Yields Reflect Persistent Wall Street Control
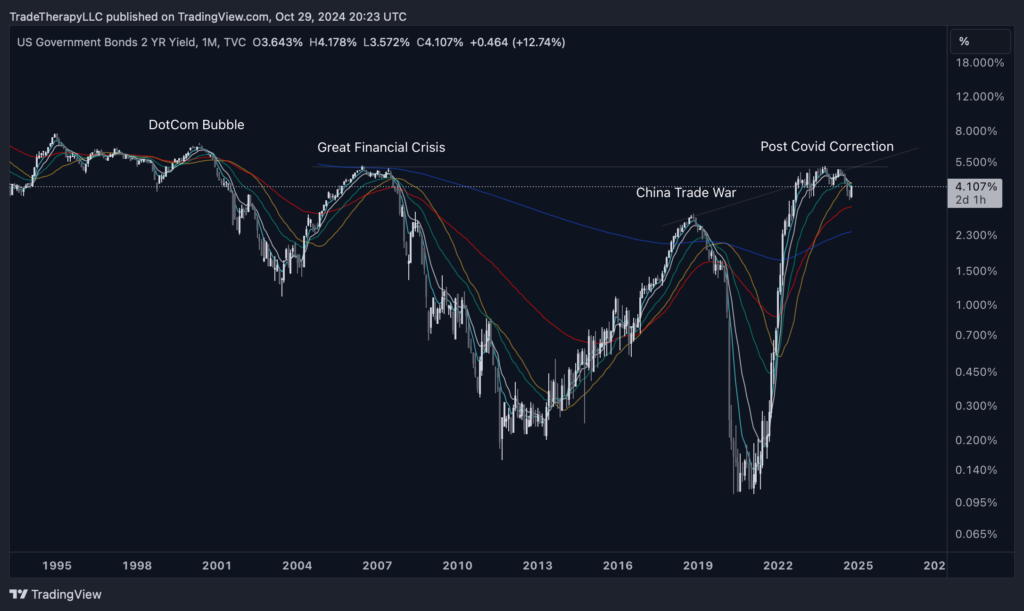
This is the monthly view of the front end of the yield curve, the U.S. Government 2YR Bond Yields. Throughout the year, we’ve discussed how the 2YR and 7-10YR yields are what have kept the yield curve inverted. Although overall the 2YR is finally beginning to break down, October’s candle is more reflective of the previous three years of inflation hysteria and rising rate fears. Recent tests of the moving average cluster suggest an impending rejection and drop in yields, signaling possible shifts in November and December.
The steep rise we saw from June 2021 through April 2022 is unprecedented. Never before have we seen such a violent reaction in the markets. What’s also very interesting is how long the top lasted. Look how long it takes for yields to roll over and begin to decline. Again, were we really in danger of another global shutdown? Or a deep recession based on (fill in the blank)? For three years? Longer than the Great Financial Crisis and the Dotcom bubble?
The chart speaks for itself and is nothing new. We’ve been discussing it all year. It’s just amazing that even after the first rate cut, Wall St. is still picking the carcass clean.
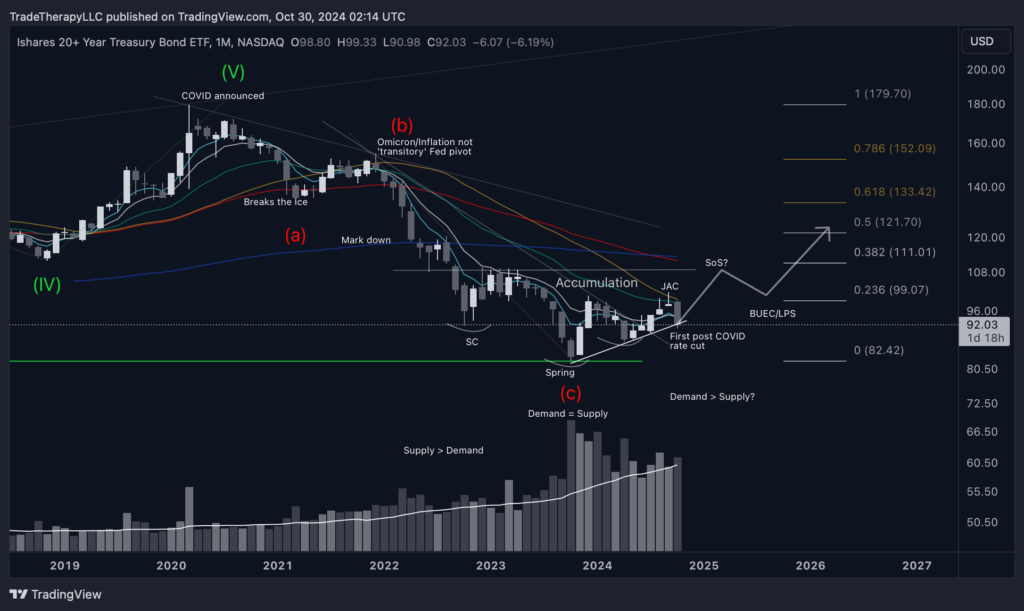
This, again, is the exact same chart we shared last month. As we mentioned in FTTC in June and consistently throughout the year, it’s not uncommon to see late-stage shakeouts that backtest demand lines and find demand. This is very typical of institutional tactics that we’ve covered all year. We were expecting volatility, and, again, we’re getting it.
During these periods, financial institutions are looking for liquidity. Whether they’re still accumulating before they launch their new markup process or selling the last bit of their previously accumulated position, they need buyers and sellers, which is what creates this type of price behavior.
This monthly chart for 20+ Year Treasuries (TLT) provides an example of looking for sellers and pushing as many retail traders out as possible. Until price exits this accumulation range, this process will continue. The good news is it should be exiting the range soon.
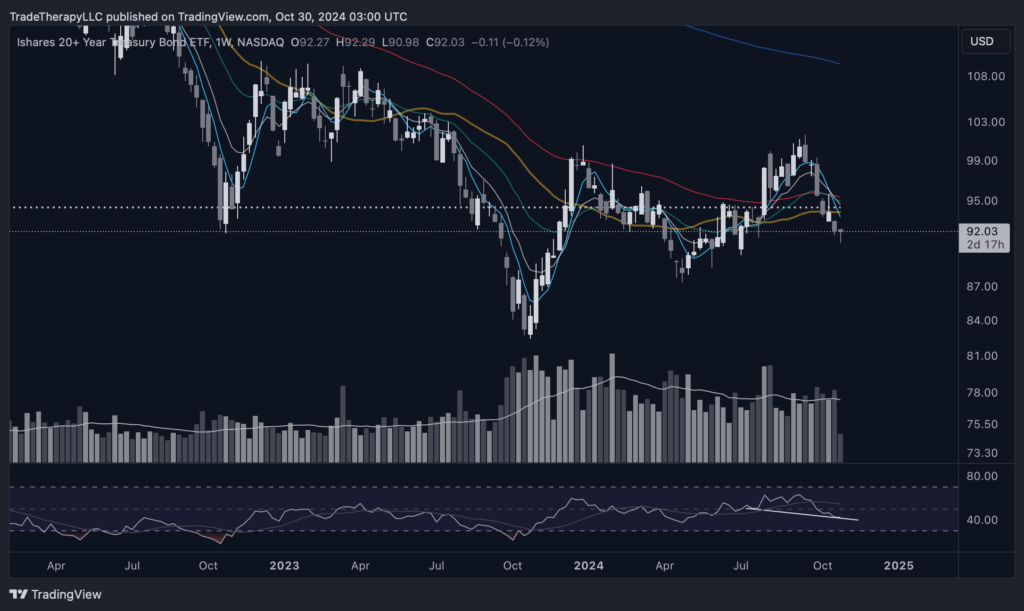
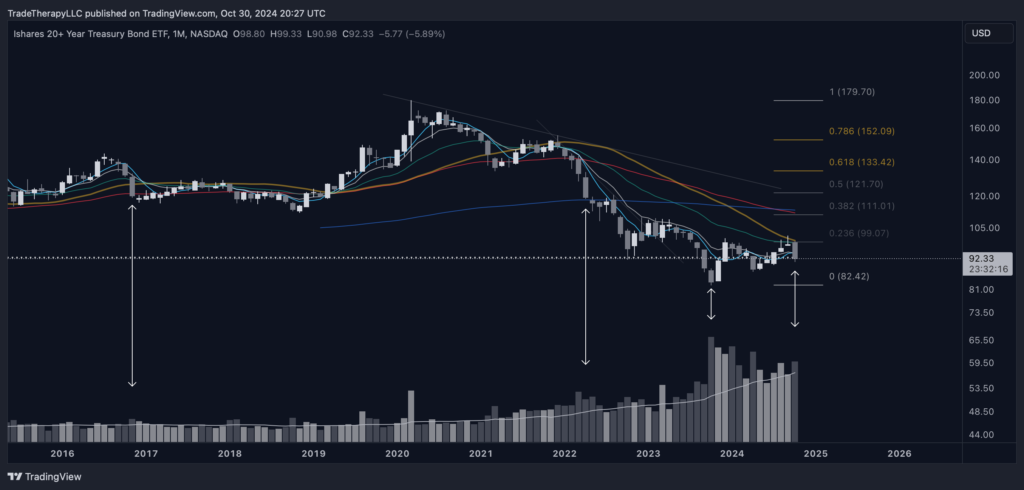
This weekly view shows volumes are still elevated, and efforts to push prices lower are being met with resistance. Though early, the current weekly candle is forming a reversal hammer. The wick below the recent low from the week of July 2022, so far, appears to be a liquidity grab. Does this mean it can’t temporarily push lower to go after the previous low at $89.78? No. It doesn’t, and it might. However, there is bullish divergence present, and the attempts to push lower are struggling. Compare the length of the corrective wave from Dec. ’23-Apr. ’24 to today.
Financial institutions are attempting to attract retail investors to positions they’re preparing to sell and push them away from positions entering a new uptrend. Stocks that we’ve covered this year (SMCI) that are in the process of marking down are pushing higher while assets that have been under heavy accumulation push lower. It can be frustrating and difficult to watch. Keep a longer time frame in mind and remember, this is temporary. These massive positions weren’t acquired to sell off. They’re not going to take themselves out of their positions.
What can we work with?
Change can be difficult and frustrating. Although we seem to be moving backwards, it feels like this is just a test. We need to stay focused on our plan and see it through.
Coming into this period, we were expecting to see volatility. We’ve been discussing accumulation tactics all year and the expected market conditions that will result from easing monetary policy. Banks are still trying to accumulate while they take profits from positions in areas of the market that were less sensitive to interest rates. We’re seeing a lot of backtesting (BUEC) price behavior as supply vs. demand continues to be tested. It’s important to remember the cycle and be prepared for volatility as we may not be done with it. The market is still showing the same setup that could translate to a post-election shakeout.
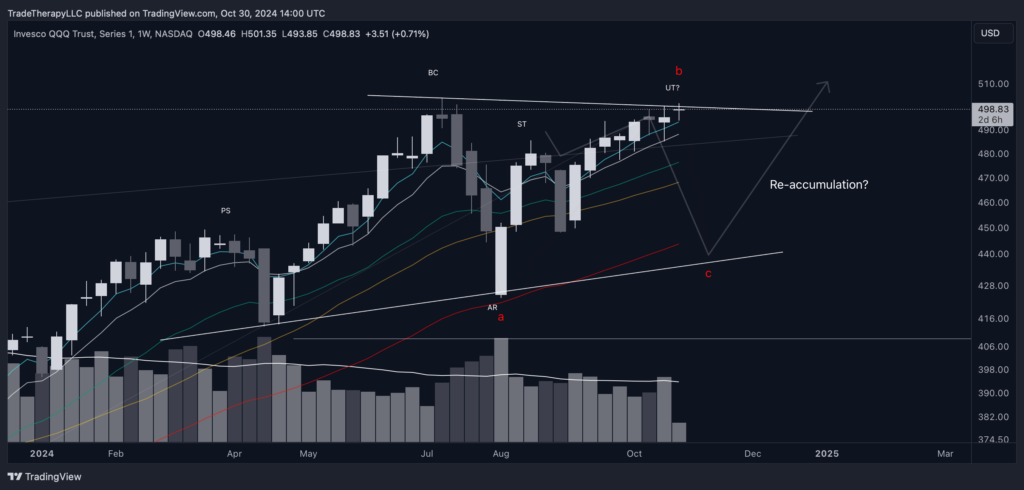
Since the ‘yen carry’ trade completed in August, we’ve been watching for reversal candles to form at the top of wave b. There’s a short position that was taken at the potential buying climax (BC) that is being defended along this trend line. Last week’s high volume, small-bodied candle is a classic reversal signal that needs to be confirmed by subsequent weeks’ candles. As of today, Weds. Oct 30, that has not occurred, but the setup is there as we see another potential reversal candle forming. Is this a grouping of reversal candles? It looks like it. We’ll have to wait and see. This does align with our thesis of rotation out of mega-cap tech and has not been invalidated.
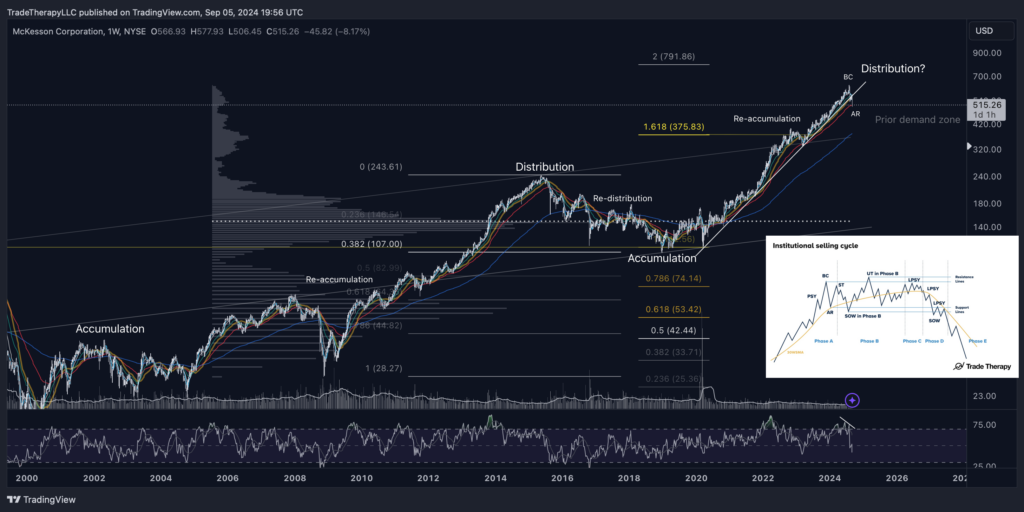
In fact, we’re seeing confirmation of rotation out of the defensive sectors that we’ve been expecting all year. McKesson (MCK) outperformed during the post-Covid correction as the Healthcare sector was considered a safe haven. Again, compare the wave strength (steepness) of the Covid/post-Covid run to the Great Financial Crisis period. Hard to believe this was a stronger market while the headlines pumped recession fears, but there it is.
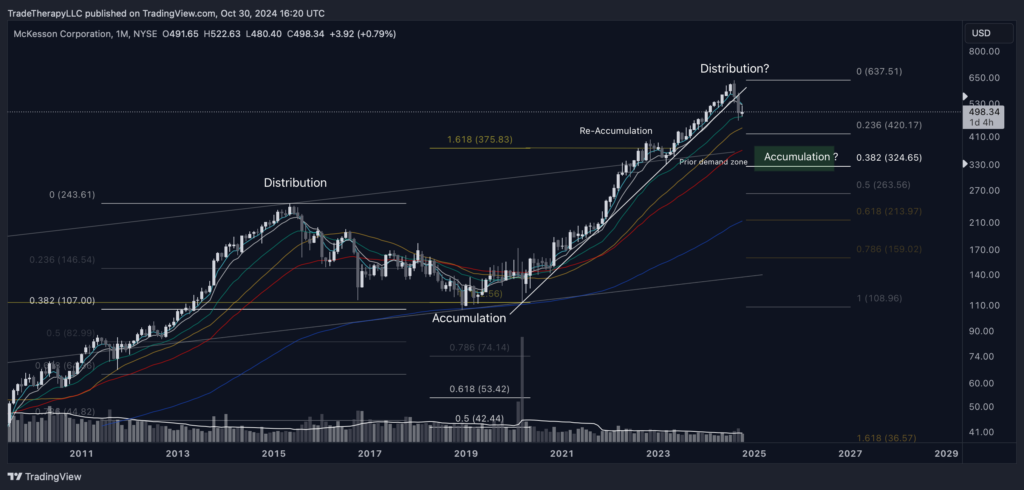
MCK breaking down and losing support is confirmation of rotation. The areas of the markets that outperformed are now weakening. Those that have already re-accumulated (like MCK) will distribute. The ones that have not (mega-cap tech) will likely re-accumulate. Always know what stage your holdings are in and what should be expected. This is the only way to ‘buy the dip’ confidently and with conviction. Otherwise, you’re just guessing (gambling).
Professional money is aware most of the retail investment community doesn’t understand the institutional business cycle. They rely on headlines to tell them what to do and how to feel. They believe the news is what drives the markets and jump in or out of positions routinely because they get scared into believing they’ve made a horrible mistake. It’s factored into the overall plan. Why do you think the positions that they’ve already taken are the ones showing such weakness in October?
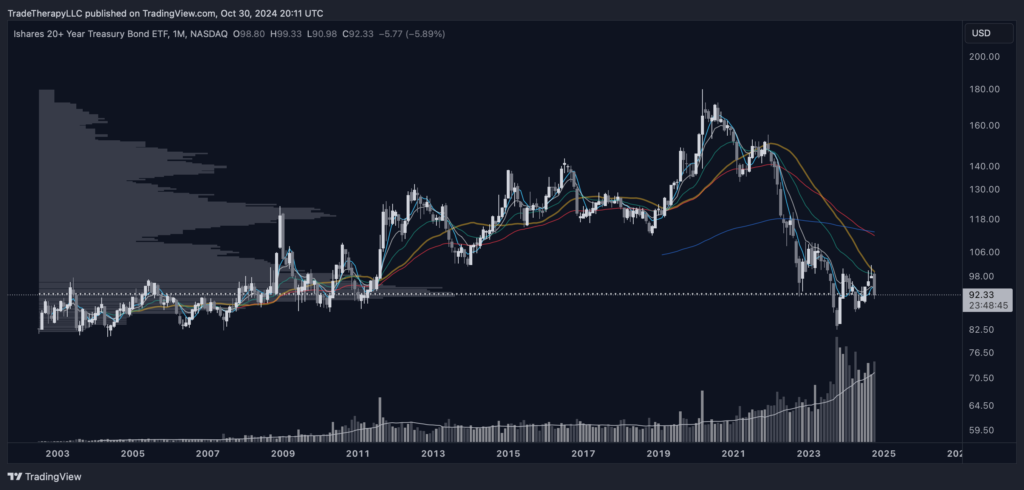
We’re seeing these tactics all over the place as we expected for the past several months. Look at the volume profile, the POC, yet October is down 5.89% (17.21% for TMF). Is our analysis wrong? Are the economics behind interest rate cuts somehow different this time? Will the yield curve stay inverted as we slip into a deep recession depending on who wins the election?
Is any of that more likely than Wall St. creating the path of least resistance backtesting support? Don’t they always push sellers out before they make big moves? Yes. They do, and this time isn’t any different.
Legendary traders like Jesse Livermore were avid tape readers. They knew reading volume and associated price behavior was the only way to identify what the larger players were doing. Richard Wyckoff spent significant time with Livermore. They were good friends and confided in each other. Most of Wyckoff’s theory is based on his experiences ‘swapping stories’ with Livermore.
Wyckoff’s third law is directly related to tape reading and something he discussed with Livermore extensively. It’s his law of Effort vs. Result. It can be summed up by stating if equal or greater amounts of effort do not produce equal or greater results, something is fundamentally changing. If selling 100 shares typically causes a stock to drop 5 points, then suddenly selling the same 100 shares only caused it to drop 1.5 points, the underlying demand has changed. Buyers are stepping in and demand > supply conditions are taking over.
Notice how much effort was required to bring prices down in late 2016 and early 2022. Now look at the bottom in late 2023 with a massive volume spike and this month’s candle. We see much higher effort with lower results. This tells us that demand > supply conditions are beginning to take over.
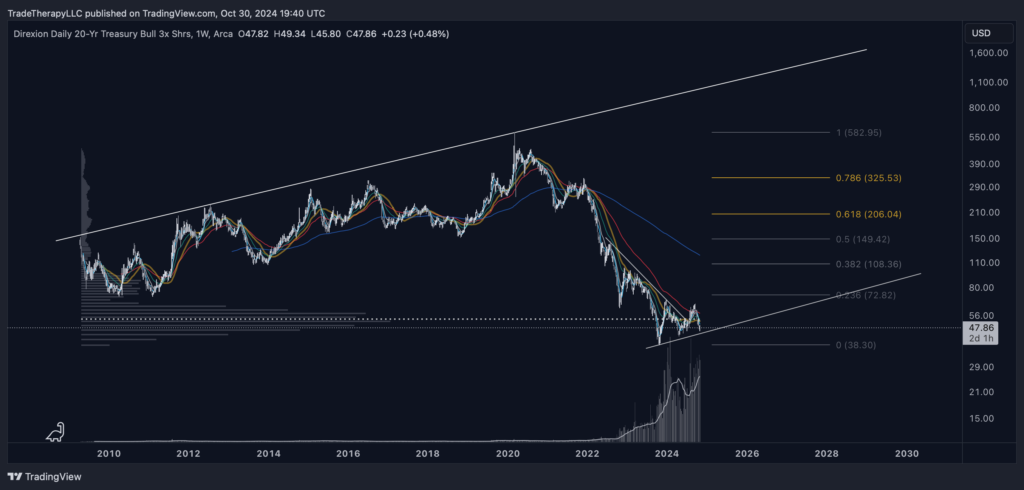
As is often the case with leveraged ETFs, Direxion’s Daily 3x 20yr Treasury Bull ETF (TMF) shows extreme examples of technical elements. Because they are leveraged, they over-exaggerate price action, which creates extreme examples of technical setups. What we see here, though, is a massive base right at current levels.
Applying Wyckoff’s third law to this chart leaves little to doubt. The effort that is being extended to backtest demand levels here is extreme. It can only be justified by expectations of a violent uptrend. Our fibonacci levels show our target expectations, which align with the market structure created by the markdown process. The .618 fib at $206.04 will be a formidable test and is our mid-longer term target. We expect to either see re-accumulation in this range or higher demand volumes to come in and overwhelm supply. This will push TMF (TLT) to higher targets and accelerate the uptrend.
Trade Considerations: Key Strategies for the Coming Months
As we’ve anticipated seasonal volatility, these trade considerations are aligned with the likelihood of an eventual uptrend in bonds, emerging markets, and small caps. Our high-conviction trades focus on the normalization of the yield curve and emerging market exposure.
It’s important to note that these are not recommendations or financial advice, but rather insights into potential opportunities we’re considering.
- Yield Curve Normalization: We remain heavily focused on opportunities related to the normalization of the yield curve, including long positions in TMF (3x Bull ETF for TLT) and potentially IEF (7-10 Year Bond ETF). These high-conviction trades are rare and present significant upside potential.
- Small Cap Opportunities: We continue to see value in IWM and its leveraged ETF counterpart, TNA.
- Emerging Markets: We remain long YINN (3x Bull ETF for China) and FUTU. BABA & SE look attractive as well. We’ll add or enter when price backtests and holds one of the shorter term WEMA and scale in should we see longer term WEMAs which we don’t expect. EDC is another attractive leveraged emerging market ETF.
- Interest Rate Sensitive Charts: We’re long both ZM & PYPL and feel both are good long term holds for this next cycle.
- Defensive and mega cap tech rotation: Rotation continues and is expected to accelerate out of the areas that outperformed during the post Covid market. MCK presents a very intriguing short opportunity that we’re looking at very closely. We did take a starter short position in QQQ last week setting our stop just above all time highs. Earnings season should be full of all kinds of surprises.
If these trade considerations look the same as last month, it’s because they are. Nothing has changed so our plan remains mostly the same other than the new short exposures.
Remember, practice responsible risk management at all times.
Final Thoughts
We’ve commented several times that during periods of trend change, confusion is created by pushing prices slightly beyond support or resistance. ‘Smart money’ can see where stops are set and have teams of technical analysts. They know exactly how far to push prices to take out stop losses and convince retail traders that their positions are breaking down. It’s their job to know and they’re very good at it. If you find yourself losing sleep over the drawdowns in your positions, your position sizing is probably too large.
This is a good time to step away from the markets. We’re entering the best months of the year for equities. Try not to watch your positions. Check back in late December or January.
Disclaimer: Trade Therapy, L.L.C. content is intended for US recipients only and is not directed at UK recipients. Our information and analysis do not constitute an offer or solicitation to buy any security and are not intended as investment advice. Content should be used alongside thorough due diligence and other sources. Opinions and analyses are those of the author at the time of publication and may change without notice. Trade Therapy, L.L.C. and its employees may move in or out of any trades detailed within our content at any time at their discretion. Employees and affiliates of companies mentioned may be customers of Trade Therapy, L.L.C. We strive for transparency and independence, and we believe our material does not present a conflict of interest. All content is for educational purposes only.
Leave a Comment
You must be logged in to post a comment.