
October did not bring fear. It brought confirmation.
Inflation came in cooler. Washington signaled stability with China. The Fed is not just cutting, it is preparing to ease financial conditions more broadly. Instead of panicking into volatility, the market did the opposite. It tightened, absorbed, and then broke out.
That is the tell.
The tape is acting like a market that just finished resetting its risk, not one that is bracing for another wave of damage. Institutions are no longer simply defending the tape. They are pressing it. This month we are looking at how that shift shows up: in the major index, in small caps, and in the way capital is rotating back toward growth. The message is consistent. The storm did not end, it cleared the air. We are now in the reset before the run.
Institutional Business Cycle – The Reset Phase Is Over
“I thought that flush in the spring was the start of the real breakdown. How did we go from that to new highs this fast?”
That is the emotional whiplash of October. Retail saw stress and assumed continuation. Institutions saw stress and treated it as inventory.
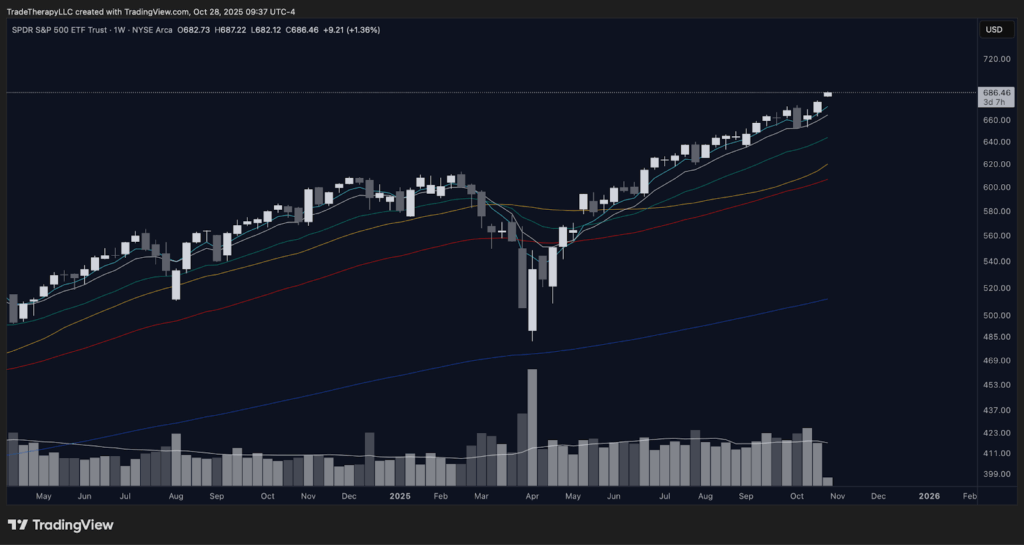
📊 SPY (Weekly): Change of character
On the clean SPY weekly chart you can see what that means in real time. After the violent downside in March and April, price did not grind sideways or bleed lower. It pivoted. EMAs realigned to the upside. Each pullback was bought at progressively higher levels. Volume calmed, not because demand vanished, but because supply was getting absorbed.
This is how institutions behave when the goal is to stabilize and reset risk, not abandon it. They do not wait for headlines that say “all clear.” They create the all clear by stepping in at scale, forcing the panic candles to become the low, then walking price higher in controlled steps.
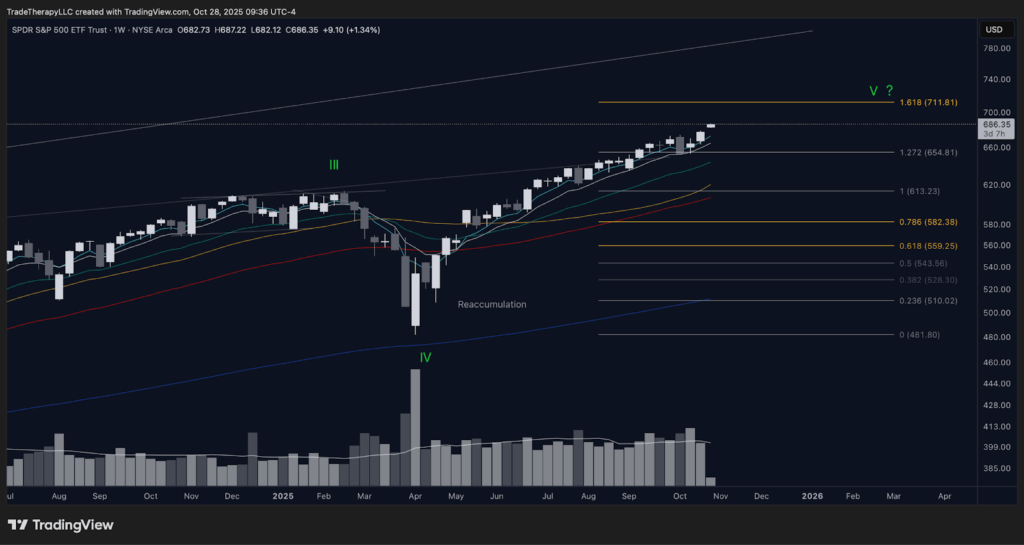
📊 SPY (Weekly Annotated): Reaccumulation and the next leg
The annotated SPY chart makes that structure explicit. The selloff into April printed a climactic low that now marks Wave IV. What followed was not failure. It was reaccumulation. The range that formed after the low was a reload zone. That range is now resolved, and SPY is pushing into the next impulse with measured extensions above. The 1.272 and 1.618 projections overhead frame a possible Wave V advance.
This matters for two reasons. First, it breaks the September mindset. September was about the eye of the storm: controlled calm, capital rotation under cover, rate cuts landing in volatility season. October is not that. October is initiation. The campaign was reset, and now it is being advanced.
Second, it tells us how institutions intend to play the fourth quarter. They are not treating SPY as a shield anymore. They are treating it as an engine again.
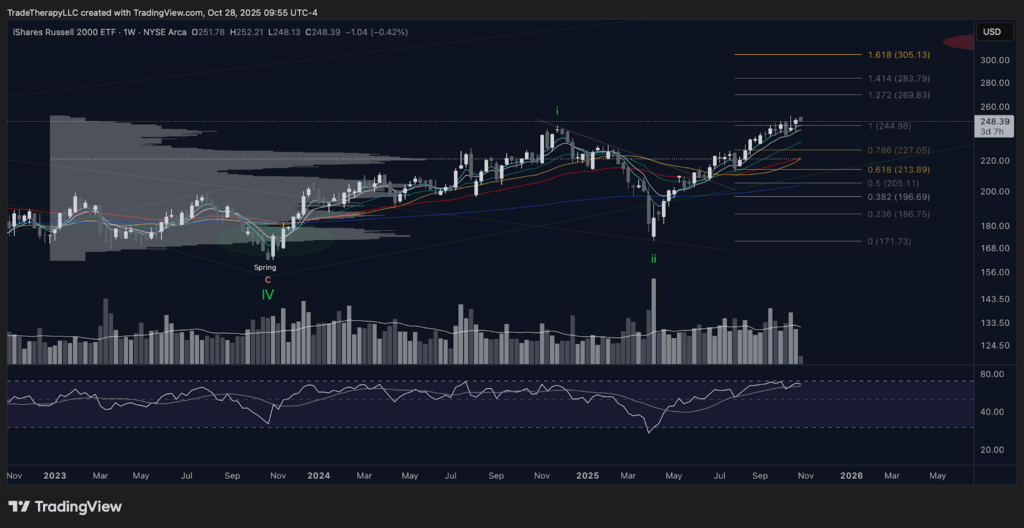
📊 IWM (Weekly): The lab is no longer a lab
Small caps were the laboratory all year. Every time liquidity tightened, IWM took the hit. Every time the market tried to turn, institutions walked IWM into resistance and watched how it behaved. That was the entire point of last month’s stress test: force the most rate sensitive part of the market to prove it could absorb supply.
Now look at IWM.
The spring that marked the bottom of the corrective wave is still intact. The follow-up low in early 2025 held and launched. The breakout above the prior shelf has stuck. EMAs are stacked in bullish order. RSI has marched from despair to strength and has stayed bid. Price is now pressing directly into the old ceiling with Fibonacci targets projecting toward 269, 283, and 305.
That is not avoidance. That is sponsorship.
This is the key business cycle tell for October. The institutional message is no longer “we are testing demand in IWM while SPY floats the index.” The message is “we are starting to scale risk into IWM while SPY powers the index.”
That shift is how breadth shows up. That shift is how a reset turns into a run.
📌 What This Means To You
October is not just a bounce. It is a transition. SPY has already moved from defense into markup after a textbook reaccumulation. IWM is no longer being used only as a stress test. It is being scaled into. ARKK versus SPY is showing that institutions are quietly reintroducing risk in the most liquidity-sensitive corners of the market.
This is what “the reset before the run” actually looks like. It is not fireworks. It is sponsorship. When institutions stop treating every rally as an exit and start treating pullbacks as inventory, the cycle has turned.
Monetary Policy – Liquidity Starts to Matter Again
“I thought we were supposed to be bracing for slowdown. Now we’ve got cooler inflation, talk of ending QT, and cuts on deck. Is this actually the all clear, or is the market getting ahead of itself again?”
That is the core anxiety this month. Retail is still looking for the rug. Institutions are already stepping into structure.
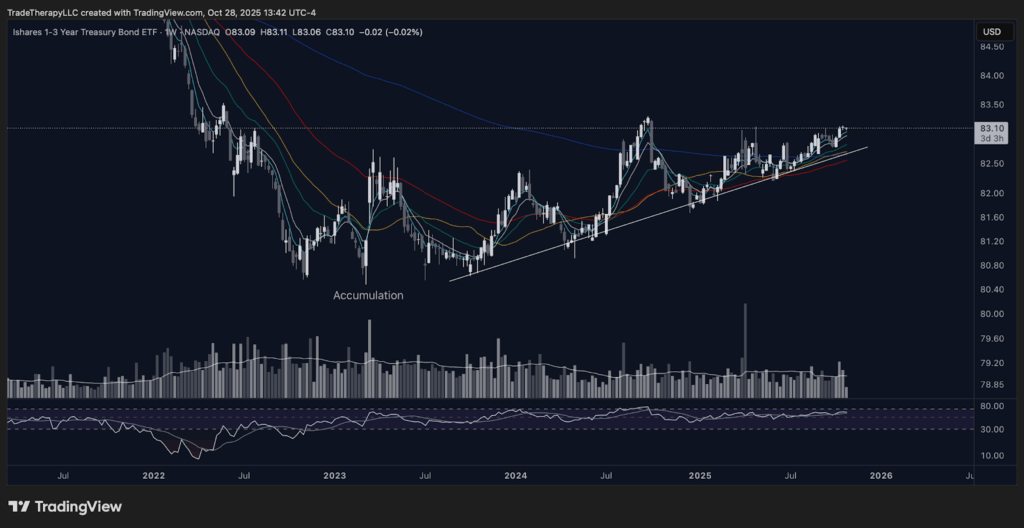
📊 SHY (Weekly): Front-end belief
The iShares 1–3 Year Treasury Bond ETF, SHY, sits at the front of the Treasury curve. This is where the market prices what it believes about the Fed in the very near term. Last year, this part of the curve was nothing but trauma. We watched a historic markdown when the “inflation is not transitory” stance forced funding costs higher and blew out anything tied to short duration.
Look at it now.
SHY has built an orderly accumulation base and then started climbing out of it in a controlled rising channel. EMAs are stacked and rising. Each dip has been defended at higher levels. Price is pressing the upper boundary of that channel instead of leaking lower. That is not fear of more tightening. That is acceptance of easing.
This is where policy stops being a headline and starts becoming positioning. The short end is telling you that the market believes the Fed is shifting from restriction toward support. It is telling you that liquidity is no longer being choked off. It is telling you that cash is getting more comfortable being put to work.
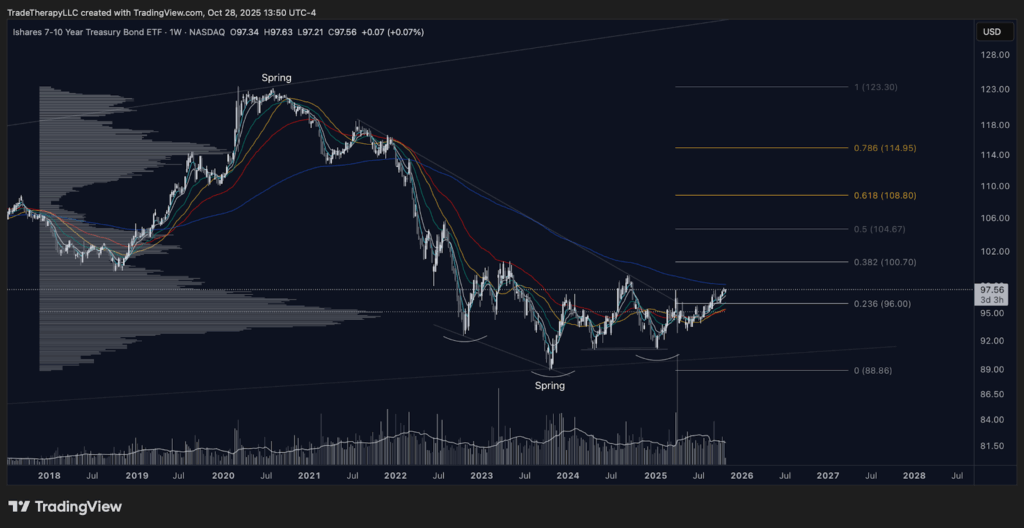
📊 IEF (Weekly): Credibility, not hope
The 7–10 Year Treasury ETF, IEF, is where institutional confidence in policy becomes visible. This is the belly of the curve — the part of the bond market that doesn’t react to headlines but to conviction.
Throughout 2023 and early 2024, IEF absorbed a violent markdown that began when inflation was declared “not transitory.” The capitulation that followed produced not one but two clear springs: the first in 2022 and a secondary test in 2024. Each was met with a surge in demand, followed by higher lows and a constructive base.
Today, the market is pressing up through the upper boundary of that accumulation range. EMAs are curling higher, RSI is in sustained strength, and the 0.236 Fib retracement around 96 has given way to a measured climb toward 100–108 — the next zones of supply.
This is not about guessing whether the Fed will cut once or twice. This is the bond market saying that the policy regime itself is changing. The middle of the curve only behaves like this when the forward path of rates is credible. It is the confirmation that the market believes easing is not a headline experiment — it’s a commitment.
📘 Institutional Literacy
When the belly of the curve begins to lift ahead of a Fed decision, it signals something larger than optimism. The front end (SHY) prices what the Fed says it will do; the belly (IEF) prices what institutions believe it can do. Together, they form the backbone of liquidity expectation. A synchronized uptrend means institutions expect not only lower short-term rates, but an entire curve that will steepen in support of risk assets.
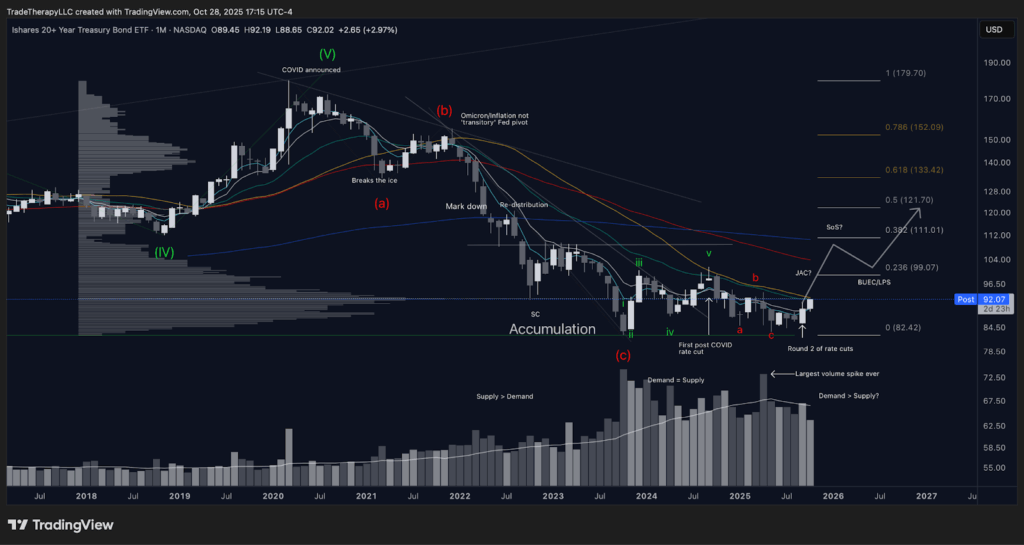
📊 TLT (Monthly): The long end is waking up
The iShares 20+ Year Treasury Bond ETF, TLT, is where you see whether institutions are ready to embrace duration again. This is not the tactical hedge part of the curve. This is where big money positions for “the next regime.”
The structure is almost textbook. After the COVID peak and the markdown that followed the “inflation is not transitory” pivot, TLT went through a full distribution, then a violent, multi-stage liquidation. That liquidation ended in a selling climax and bled into a wide accumulation range, with historic volume absorption. We then saw the first post-COVID rate cut, and now a second round of cuts, and with each one TLT is printing higher lows against that base instead of making new lows.
Now look at the current candle. We are starting to see TLT attempt to lift off the floor of that accumulation range. The EMAs on the monthly are still overhead, which means this is early. That is important. You can literally see the process that professionals use: absorb supply at the lows, defend the lows, step into higher lows, and only then start building a campaign with targets into retrace levels like 99, 111, 121, and 133 and beyond.
TLT turning like this says something simple and very bullish for risk assets. It says: the market is starting to believe that the era of relentlessly rising yields is done. The market is starting to believe that financing costs will get easier, not tighter. That belief is the fuel for multi-quarter risk appetite.
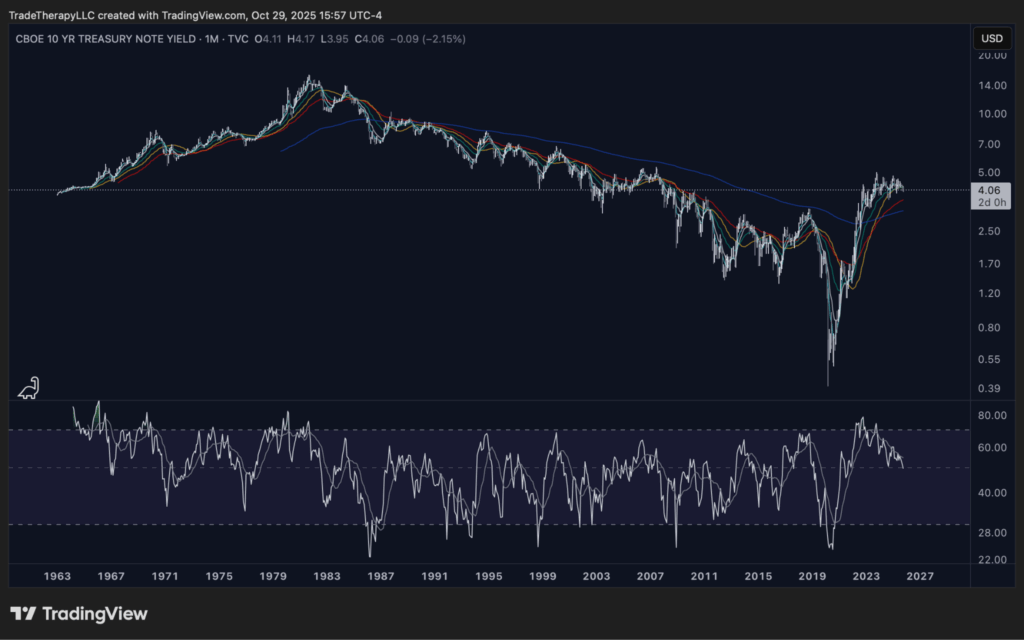
📊 TNX (Monthly): Distribution confirmed by moving averages
The 10-year yield has now lost every monthly EMA except the 55 and 200. Each rally into the declining 5, 9, and 21 has failed. RSI has rolled from the prior overbought regime into a mid-range downtrend, consistent with a post-distribution glide. This is the mirror image of TLT’s base. Yields are no longer applying pressure. They are releasing it.
📌 What This Means To You
When the front end stabilizes (SHY), the belly lifts (IEF), the long end wakes up (TLT), and TNX loses its shorter monthly averages, liquidity stops fighting you. That is the policy backdrop institutions wait for before scaling duration and future-cash-flow exposure. It is the reset that precedes the run.
Supply vs Demand – Pricing Tomorrow
“I see breakouts everywhere, but is that just a chase, or is the money actually getting cheaper?”
You are not crazy to wonder whether this is another head fake. When the dollar is firm, future cash flows get discounted harshly and high-beta rallies fizzle. When the dollar rolls, oxygen returns to growth. The question in October is simple. Has the dollar finally turned in a way that validates what we have been seeing on individual charts for months?
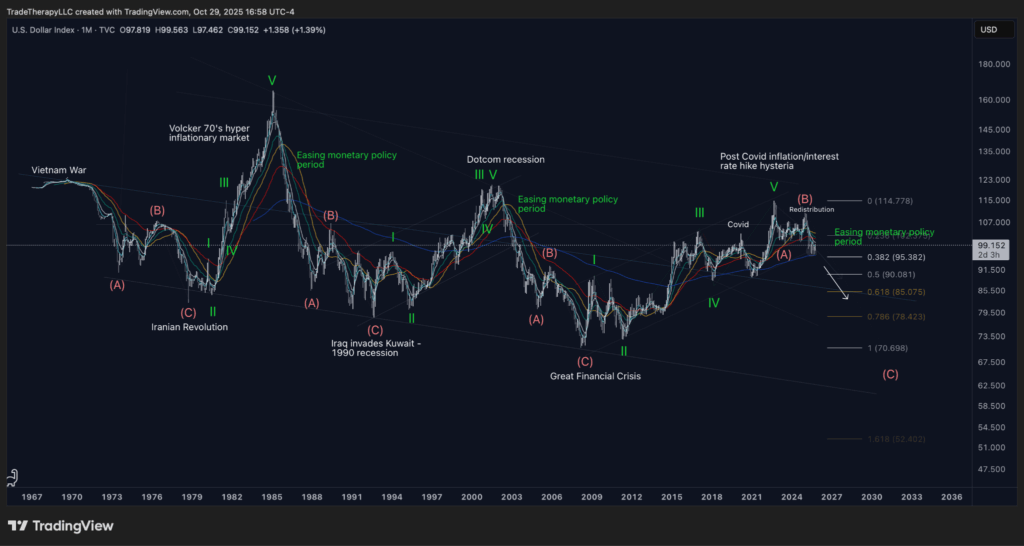
📊 DXY (Monthly, All-time): Third major top, easing regime
This is the third major cyclical top in the last four decades. The prior two tops resolved with persistent lower highs and eventually new lows, coinciding with multi-year easing cycles. Today’s structure rhymes. After the post-COVID squeeze and the “inflation is not transitory” shock, DXY built a redistribution range, failed the retest, and is slipping toward 95.38, then 90.08, with deeper retrace levels at 85.08 and 78.42. Monthly EMAs are rolling from support to resistance. That is what an easing monetary regime looks like on the dollar.
Institutional framing
When the dollar transitions from distribution to markdown, two things happen that matter to equity portfolios:
- Global funding pressure eases, which supports risk across regions and cyclicals.
- Duration gets paid. As the discount rate falls and FX headwinds soften, the market is willing to value tomorrow’s cash flows higher today.
That is why innovation, software, fintech, and crypto-adjacent names have been re-bid while the curve has been turning. The rotation is not random. It is a rational repricing of future money.
📌 What This Means To You
If the dollar continues this monthly roll, the path of least resistance favors assets whose value is back-loaded. That does not mean buy every high-beta chart. It means align with names where the business has rebuilt a base, supply has been absorbed, and the tape shows controlled accumulation into strength. The dollar’s fade is the backdrop. Your edge is picking the campaigns that institutions already started.
💡 Cycle Mechanics: Calm as Rotation Cover
What looks like serenity in SPY masks the rotation beneath it. IWM’s breakout tests and the IWM/SPY ratio’s bottoming echo of 2020 both confirm the same point: institutions are using September’s calm to reweight risk. They are not chasing; they are repositioning. For traders, the lesson is to look past the surface calm and focus on where liquidity is quietly turning — because those rotations decide who leads once the storm resumes.
Supply vs Demand – Rotation Beneath the Calm
“Breakouts look strong, but what happens when the next squall hits? How do I know which ones hold and which ones fold?”
That is the tension inside September’s calm. Institutions are not chasing every breakout. They are rationing exposure, testing demand in the sectors that benefit most from easing cycles, and quietly rotating capital toward innovation names that have been stress-tested for years. To the untrained eye, it looks uneven. To professionals, it is how campaigns are seeded during the eye of the storm.
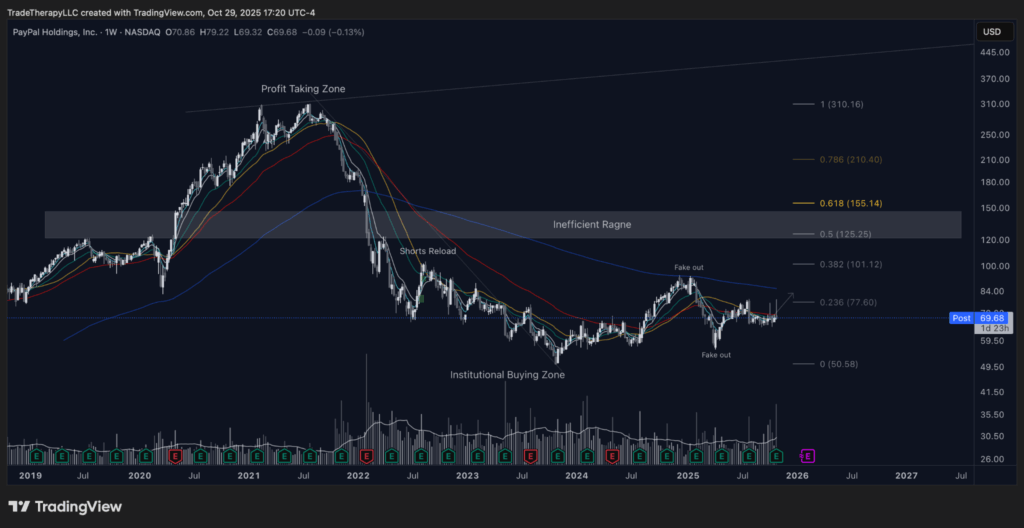
📊 PYPL (Weekly, Oct 2025): Basing campaign with recycled inventory and an inefficient range overhead
Context and cycle. PYPL is not a breakout story. It is an inventory rebuild after a full distribution and markdown. The OpenAI headline spike and complete retrace did not invalidate the repair. It reset positioning. Since then, price has carved higher lows inside a broad institutional buying zone while the 5, 9, and 21 EMAs flatten and begin to stack under price. That behavior says time is being used to replace reactive holders with patient capital.
Supply and demand. The fakeouts beneath support were useful. They flushed late longs, invited short reloads, and allowed stronger hands to bid into weakness. Subsequent rallies have stalled into a shallow retrace band, which is where trapped supply should appear. The test is whether pullbacks from that band contract in both range and volume while the rising EMAs catch price. If demand is truly in control, acceptance above that first shelf should shift the fight to the large inefficient range created during the breakdown phase. That zone, roughly 125 to 155 on your chart, is where professionals will harvest inventory into strength rather than chase.
What to watch. Evidence of sponsorship is simple. Respect of the rising 5/9/21 EMAs on dips, shrinking downside volume on tests, and a higher low above the prior base floor. Acceptance through the initial retrace with a low-volume retest that holds would confirm transfer of supply and open the path to work the inefficient range. Failure back through the base on expanding volume would say the transfer is incomplete and returns PYPL to patience only.
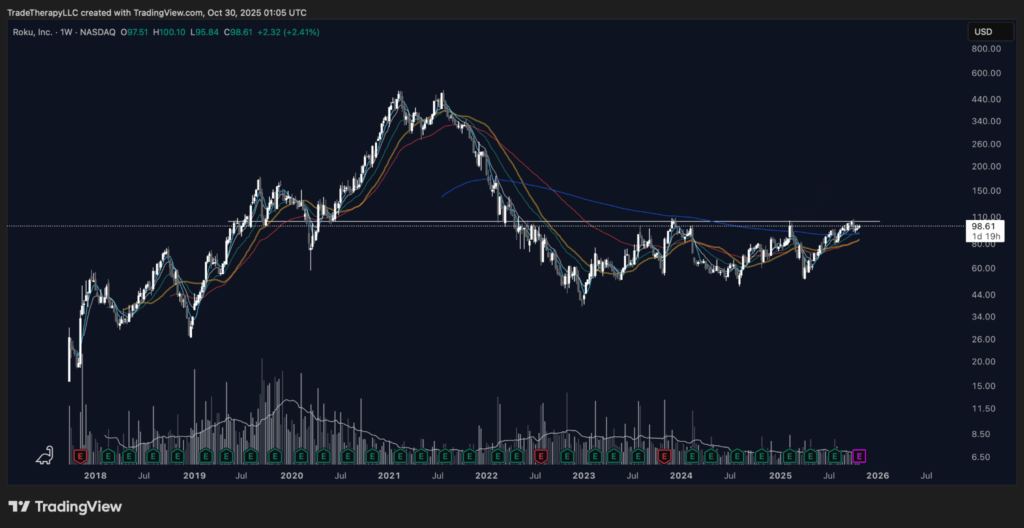
📊 ROKU (Weekly, Oct 2025): Reaccumulation pressing the all-time pivot
Context and cycle. ROKU spent two years repairing the damage from its prior distribution. That repair phase created a broad reaccumulation range under the original breakout level. Institutions used time to reduce volatility and to reload inventory at higher lows. The weekly EMA stack (5/9/21) is now rising under price and acting as a moving demand zone, which is how professionals keep control while they work a ceiling.
Supply and demand. Each probe into the pivot has met supply, but the reaction lows keep stepping up and pullback volume keeps contracting. That is steady absorption. When the next drive into the pivot prints expanding volume and a close above, the prior ceiling becomes a last point of support. The first validation is a low-volume retest that holds the converted pivot. From there, overhead inefficiencies from the breakdown phase become harvest zones where inventory can be distributed into strength in stages rather than chased all at once.
What to watch. Sponsorship is intact as long as pullbacks respect the rising 5/9/21 EMAs and weekly closes hold above the most recent shelf. A failure through the shelf on expanding volume would say absorption is incomplete and that the range needs more time. Until that failure, the tape favors continuation and range fill higher once acceptance above the pivot is achieved.
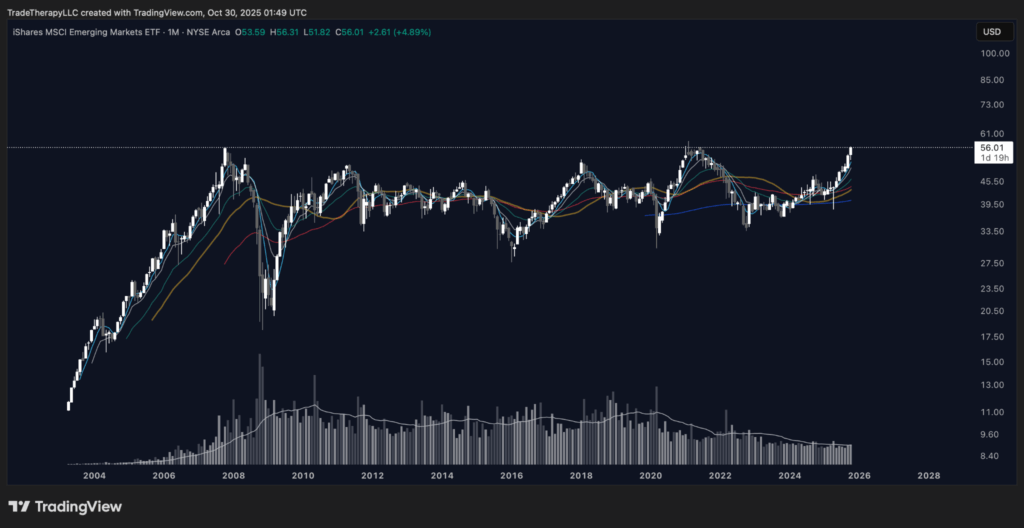
📊 EEM (Monthly): Eighteen-year base testing the highs
Context and cycle. EEM is an ETF proxy for the MSCI Emerging Markets Index. Since the 2007 peak it has cycled through a long sequence of failed breakouts and deep tests that gradually retired overhead inventory. That is a classic secular base. The monthly EMA stack has turned up and price is now attacking the old ceiling with a softer dollar and easier global funding conditions at its back. This is how a secular markup begins. It starts with the index refusing to make new lows despite repeated macro shocks, then transitions to higher lows and longer thrusts.
Supply and demand. The most important tell is how the market behaves after contact with the prior high. If supply is still dominant, the rejection will be sharp and range-wide with expanding volume. If demand has the upper hand, the breakout will print acceptance above the prior high, then a controlled, low-volume pullback that holds that level as a last point of support. That retest is where institutions typically add, since it confirms that overhead inventory has been transferred from weak hands to strong hands.
What to watch. Confirmation is not just a print above the high. It is acceptance and a successful test. If that behavior appears, the base can be treated as complete and the new campaign targets prior inefficiency bands created during the 2007 to 2020 distribution era. If the retest fails on expanding volume and closes back inside the range, the base remains in progress and patience is required while supply is further absorbed.
Final Thoughts – The Reset Before the Run
October validated the shift we have been tracking. SPY resolved a reaccumulation, IWM is being sponsored rather than stress-tested, and ARKK vs. SPY shows risk appetite returning in a controlled way. The curve has turned from headwind to support and the dollar’s monthly roll is releasing pressure on future cash flows. That is the institutional recipe for early markup. It is not a chase. It is sponsorship.
What matters now is behavior at the edges. If SPY holds higher lows above the recent reload zone and IWM converts its ceiling to support, breadth should continue to expand. If SHY and IEF maintain their uptrends while TLT continues to build off the base and TNX stays capped beneath its shorter monthly averages, policy will keep adding oxygen. If DXY continues to fade on the monthly, duration and innovation will keep the bid.
Your playbook should be simple and disciplined. Add on controlled pullbacks into rising 5, 9, and 21 EMAs where prior supply has already been absorbed. Let shelves prove themselves with low-volume retests rather than buying thrusts. Harvest into known inefficiency bands and prior supply pools. Respect invalidation quickly if a shelf fails on expanding volume or if the dollar snaps higher and yields reclaim lost ground.
The storm cleared the air. The reset is complete. If the market keeps answering tests with acceptance and light-volume pullbacks, the run is underway.
Want the deeper dive?
FTTC is free because we want traders thinking bigger, but Clarity is where we map every move with precision. Every week, Clarity zeroes in on a featured spotlight ticker, builds a top‑down view of the broader market, rotating roughly 35-50 stocks, ETFs, crypto, and indices in total.
👉 Check out Clarity here — and start trading the cycle with the same patience and intent as the institutions who control it.
Disclaimer: Trade Therapy, L.L.C. content is intended for US recipients only. Our information and analysis do not constitute an offer or solicitation to buy any security and are not intended as investment advice. Content should be used alongside thorough due diligence and other sources. Opinions and analyses are those of the author at the time of publication and may change without notice. Trade Therapy, L.L.C. and its employees may move in or out of any trades detailed within our content at any time at their discretion. Employees and affiliates of companies mentioned may be customers of Trade Therapy, L.L.C. We strive for transparency and independence, and we believe our material does not present a conflict of interest. All content is for educational purposes only.
Headlines used for educational analysis under fair use; all rights reserved by original publishers