
“There’s been a lot of movement lately—sharp rallies, sudden pullbacks, nonstop headlines. How are you making sense of it all?”
Honestly, I’m not. It feels like every time things start breaking down, the market reverses higher. But the rallies don’t feel strong either. Nothing’s clean. It’s like I’m stuck swimming against the current.
That’s because you are.
This isn’t a normal tide—it’s a rip current. A violent undertow beneath the surface of the market, pulling capital in directions that defy logic, headlines, and emotional instinct. On the shoreline, everything looks calm. A few soft waves. Maybe some froth. But beneath the surface? Momentum is ripping the other way—swiftly, silently, and with purpose. Most people don’t realize they’re caught until it’s too late.
That’s the market right now. Headlines scream stagflation, AI bubbles, and geopolitical chaos—but structure is quietly pulling institutions back into risk. It’s not clean. It’s not comfortable. And it’s not supposed to be. That’s how rip currents work: they exploit your instinct to fight, to panic, to swim back to safety. Retail tries to escape the discomfort by bailing out of volatile setups—while institutional capital is being deployed exactly where the pain is deepest.
We’re seeing it play out across the major indices, and the divergence is subtle but undeniable. SPY is reaccumulating through controlled volatility. IWM is completing late-stage accumulation beneath a deceptive base. XLK is breaking out quietly, while retail rotates out of tech in search of “safer” names. None of this is a coincidence. This is how institutions realign before the next markup cycle—by engineering exhaustion and hiding opportunity beneath disorder.
Let’s walk through each chart—and examine how structure, not sentiment, reveals where capital is flowing.
SPY – Late-Stage Reaccumulation and the Pull Beneath the Surface
There’s a moment in every campaign when retail investors breathe a little easier. The volatility subsides, the headlines quiet down, and price starts to stabilize. After the chaos of April, that’s exactly where SPY seemed to land. The fear had crested. The Fed chatter faded. Earnings landed soft. It felt like the storm had passed.
But that feeling—that false calm—is the entire strategy.
What April delivered wasn’t a breakdown. It was a bloodletting. And the ones who bled were retail traders still chasing news cycles instead of structure.
📊 Chart – SPY (April 2025): The Shakeout That Set the Trap
Late-cycle fear masked institutional reaccumulation as the crowd focused on headlines instead of data.
That late-month flush violated key support, triggered stop cascades, and generated panic just long enough to make it look real. But structurally, nothing broke. Volume surged as price dropped, and RSI carved a clean divergence beneath the lows. Institutions weren’t exiting. They were resetting. Absorbing. Reestablishing control while the crowd scrambled to interpret headlines.
The chart never lost form. The emotional tape did.
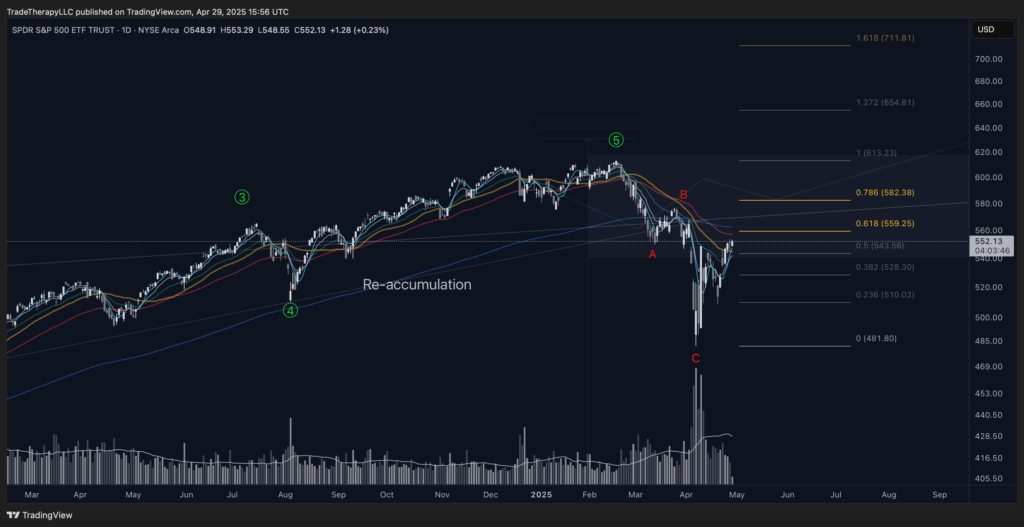
Now, weeks later, the picture is clearer. The V-shaped recovery didn’t just bounce—it reclaimed all major weekly moving averages. The tape has stabilized. Volatility has faded. And SPY is grinding back into the top end of its range.

📊 Chart – SPY (May 2025): Late-Stage Reaccumulation and Structural Realignment
V-shaped recovery, reclaimed trend, and a push toward all-time highs confirm the institutional roadmap.
This is not early accumulation. This is not euphoria. This is late-stage reaccumulation—the part of the cycle where the structure tightens, conviction builds, and positioning aligns for breakout.
And this is the essence of the rip tide.
It’s not the obvious danger that takes you. It’s the pull you never noticed. April’s panic was just enough to drag participants out of position. It made the surface look risky. But underneath, institutions were executing. Quietly. Efficiently. Pulling liquidity into their hands while everyone else fought the current.
Now the chart reflects that shift. What felt like a breakdown is proving to be a setup—the final consolidation before continuation. Demand will still be backtested. Emotion can still be weaponized. But the structure tells the story: SPY is preparing to move out of the range, not collapsing through it. The campaign continues.
IWM – Generational Base Beneath the Surface
For the better part of two years, IWM looked like dead money. While the S&P kept pressing new highs, small caps went nowhere—stuck in a range, forgotten by the crowd. Retail gave up. Analysts stopped watching. Momentum traders looked elsewhere. That’s exactly when institutions get to work.
Because boredom is a feature, not a bug.

📊 Chart – IWM (May 2025): Silent Accumulation and the Thickest Volume Profile on the Tape
Multi-year range compression with anchored volume confirms long-term structural commitment.
This chart isn’t just building a base—it’s building pressure. The volume stack beneath price is one of the thickest on the tape. The kind that signals deep, institutional accumulation. RSI divergence has been building for nearly a year and a half. Quiet higher lows beneath a flat price tells the story—buying strength under the surface, not weakness.
And that’s what makes this setup so dangerous to ignore. It doesn’t just represent structural support. It represents strategic positioning. This is how Wall Street traps retail on the sidelines—by making the asset look irrelevant right before it moves.
This is the rip tide. Still on the surface. Powerful underneath. When it breaks, it won’t drift—it’ll rip. And those who weren’t paying attention will be left behind, wondering how something so “boring” moved so fast.
XLK – The Surge That Follows the Pull
Back in January, we were watching XLK for a textbook Wave 2 setup. Momentum had peaked. Divergences were forming. Price had begun to stall near its 1.618 extension. But this wasn’t a call for collapse—it was a call for rotation. Smart money doesn’t chase stretched moves. It uses them to rotate risk, shake out weak hands, and build the base for the next leg.

📊 Chart – XLK (January 2025): Waiting for Wave II
Rising wedge exhaustion with bearish divergence signaled the need for a rebalancing phase.
And that’s exactly what happened.
The tariff scare in March provided the perfect cover—headlines flared, volume spiked, RSI broke. The flush was sharp, emotional, and deliberate—but it didn’t trigger breakdown. It triggered reversal. The spring held. RSI confirmed. And now, just weeks later, XLK is back above all major moving averages, pressing into prior highs with fresh participation.

📊 Chart – XLK (May 2025): Spring Reversal and Markup Resumption
Wave II confirmed via engineered flush. Volume rebuilt beneath, RSI turned, and markup resumed above trend.
This is what most traders miss: Wave 2 isn’t supposed to feel bullish. It’s supposed to feel broken. Because that’s what allows institutions to reload without competition. And while everyone was asking if the AI trade was dead, Wall Street was getting back to work.
The chart says it all. The reversal was fast. The volume built quickly. RSI broke its own downtrend and made a higher low—confirming demand beneath the surface. And the price has now reclaimed the exact zone where it previously failed. That’s not random. That’s positioning.
This is the final phase of the rip tide.
SPY showed how institutions defend existing campaigns. IWM showed how they prepare new ones. But XLK? XLK is where they strike. It’s the move that looks too risky after the fact. Too fast. Too soon. But it only feels that way to those who swam against the current—when the smarter move was to let the structure carry you.
Markup doesn’t start when it feels safe. It starts when it feels premature. That’s what makes it institutional.
✅ The Rip Tide Revealed
The three charts we’ve just examined aren’t just stages of technical recovery—they’re milestones in the institutional business cycle. IWM spent over a year absorbing supply through boredom, creating one of the most structurally significant bases in recent memory. SPY completed a clean V-shaped reaccumulation and is now attempting escape velocity, supported by strong internal alignment. XLK, having endured a carefully engineered tariff flush, has already resumed markup—well ahead of retail conviction.
Together, they reveal the full sequence: end-stage accumulation, late-stage reaccumulation, and renewed markup. And each phase has been executed with discipline, not randomness. Headlines created the emotional distraction. Structure reveals the roadmap. This is what a rip tide looks like in markets—not chaos, but quiet control, pulling capital away from where it’s supposed to be.
And while these structural signals reveal how institutions are positioning beneath the surface, there’s another layer of this current that often goes unseen—the monetary one. Because when the Fed speaks, it’s not just the headlines that react. It’s the playbook.
🌀 The Calm That Covers the Current
“Does it feel like everything is stable on the surface, but leaving you second-guessing every move you make?”
Because nothing adds up. Rates aren’t dropping, the headlines say inflation’s cooling, and yet the market moves like it knows something we don’t.
That tension is the policy.
Right now, the surface looks still—no hikes, no cuts, no fireworks. But beneath that calm is a powerful undercurrent of repositioning. This isn’t a market waiting for a Fed pivot. It’s a market being pulled by forces most investors don’t see—until they’ve already been swept away.
We’re in a stage where monetary policy isn’t changing through action—it’s changing through inaction, weaponized by narrative. Every move the Fed doesn’t make becomes a blank canvas for fear. “No cuts” becomes “higher for longer.” “Pause” becomes “policy mistake.” And just like that, the media gets what it needs: volatility, panic, and emotional capitulation.
But the charts tell a very different story.

📊 Chart – TLT (May 2025): Accumulation Base and Post-Spring Shakeout Multi-year markdown has resolved into structured accumulation. Volume confirms the spring low is being defended, with a potential BUEC/Sign of Strength forming off $85 support.
TLT: The Emotional Anchor Beneath the Calm
At a glance, TLT still looks broken—trapped near cycle lows, unloved, and unwanted. But to anyone reading structure, this is no longer a chart in distress. It’s a chart in final-stage accumulation.
The mark down phase ended in late 2023 with a massive spring—a violent flush to new lows, followed by the strongest weekly volume in the ETF’s history. Price rebounded immediately, reclaiming support and triggering a reaccumulation sequence that has been unfolding quietly ever since. No new lows. No structural breakdown. Just supply absorption through time.
And now, in May, we’ve completed what appears to be an “abc” corrective pullback—an orderly retest of the spring zone into the $82–85 band, where volume has remained elevated and RSI divergence is once again building. That’s not weakness. That’s control. This is how institutions buy size: they suppress excitement, control the tape, and accumulate inventory while everyone else is distracted by headlines.
If this structure holds, we could be looking at the beginning of a long-term campaign toward $111, $121, or even higher levels into 2026. And the market won’t wait for a Powell press conference to confirm it. The smart money is already moving. And they’ve been using every “no landing” headline to do it.
TNX: Engineered Spikes, Institutional Timing
This cycle hasn’t been defined by steady policy—it’s been defined by volatility shocks. And no chart exposes that better than TNX. Twice in the past 12 months, yields have exploded higher without any actual change in Fed policy. First during the yen carry trade unwind in August 2024, then again during the tariff scare in April 2025. Both were used by the media to reintroduce fear, revive inflation anxiety, and justify broad equity weakness.
But if you look at the structure, something else becomes clear: these spikes weren’t organic—they were engineered distribution tactics. TNX has been stuck inside a massive topping range since late 2022. The initial markup phase completed. The upthrust into 5% confirmed the UTAD in 2023. Since then, every bounce has been weaker, momentum has waned, and the chart now shows classic signs of distribution resolving into markdown. In both the yen and tariff events, yields were driven sharply higher into prior resistance—only to fail, reverse, and fade.

📊 Chart – TNX (May 2025): Media-Driven Spikes Within Distribution
False breakouts into fear catalysts. Each time, Wall Street reloaded—retail reacted.
This is the macro version of a shakeout: create panic, inject volatility, flood the airwaves with conviction headlines—and then absorb the reaction. Retail doesn’t stand a chance. The market isn’t responding to Powell. It’s responding to manufactured emotion. Meanwhile, the Fed remains “on pause,” and TNX continues to print lower highs, suggesting institutional demand for Treasuries is firming behind the curtain.
That’s the rip tide: on the surface, rates are “too high” to support risk. But beneath it, liquidity is already rotating. Wall Street knows that sustained yields at these levels would break the market. That’s why they’re bidding into fear events and using volatility to position—not exit.
DXY (Weekly): The Rip Current Exposed
Of all the charts we’ve tracked through the monetary misdirection, none has mapped the rip tide beneath the surface more precisely than DXY.
This chart doesn’t just reflect Fed policy—it exposes how Wall Street responds to it. Look closely, and you’ll see the real turning points weren’t at the press conferences—they were in the structure. DXY topped in late 2022 on the back of the Fed’s final aggressive hike, forming a classic Wyckoff distribution top. When the dollar broke support months later, it didn’t collapse—it redistributed. Institutions weren’t done using the narrative yet.
Then came the real break: after the Fed’s first rate cut, DXY dropped sharply through the lower boundary of that long-term range. The move shocked retail and emboldened bearish headlines. But it wasn’t the end of the move—it was the beginning of institutional positioning.
Because what came next is textbook: a backup into resistance. DXY rebounded directly into the underside of broken support—right at the UTAD high from late 2023—and stalled. Momentum failed. The range rejected price. And now, with RSI rolling over and weekly structure flatlining, the next leg down isn’t a possibility. It’s the plan.

📊 Chart – DXY (May 2025): Engineered Volatility Within a Redistribution Range
This chart shows how dollar strength has repeatedly been used to create equity market pressure—just in time for institutional reloading.
DXY (Monthly): The Macro Mask Comes Off
If the weekly DXY chart is the rip current—pulling investors off balance while the surface looked calm—this chart is the satellite image showing the entire storm system. It’s the long-term structure no one talks about. And it’s been the roadmap for everything that’s played out since the Fed’s first hike.
This is the same chart we used in the February FTTC, when we said:
“This current pullback is a perfect example of how these narratives can diverge from reality… the charts are telling a different story—a story of potential opportunity.”
That wasn’t a hot take. It was a structural read—and it’s playing out.
Four months later, the dollar’s topping pattern has only become more obvious. The 2022 spike (wave B) marked the emotional high, not the structural one. Since then, we’ve seen a failed breakout, a redistribution range, and now the early stages of a breakdown—all while volume fades and macro pressure unwinds.
Look at what this chart reveals:
- Every major dollar peak over the past 30+ years has aligned with institutional easing and risk-on equity flows.
- The 2024 spike wasn’t new strength—it was a retest, wrapped in media panic, to reload short positioning.
- Momentum has deteriorated. Structure has cracked. And the unwind is already in motion.

📊 Chart – DXY (May 2025): Multi-Decade Topping Pattern Confirming Breakdown
The dollar isn’t stabilizing. It’s distributing. And the charts have been telling us for years. Lower highs, lower lows.
🧠 Summary: Monetary Policy as a Distraction Strategy
Retail investors keep watching the Fed, but institutions have been watching the tape. While headlines painted a story of chaos—rate hikes, inflation panics, pivots and pauses—the charts quietly tracked positioning. TLT, TNX, and DXY didn’t just signal policy changes; they exposed how those changes were used to trigger emotional responses while institutions reloaded.
The bond market didn’t react randomly. The dollar didn’t surge by accident. Each sharp move aligned with Wall Street’s real motive: to generate volatility, extract liquidity, and position early.
From engineered TNX spikes to DXY strength-driven equity shakeouts, the story is the same: fear fuels entry. Confusion protects position. Silence conceals intent.
And as this section has shown, the monetary current hasn’t disappeared—it’s just been flowing underneath, pulling unsuspecting investors off course while institutional capital prepares for the next phase.
And the unwind is no longer a forecast—it’s already in motion.
🌀 Where the Current Hits the Shore
“Can you find any place out there that looks interesting?”
Who knows? It feels like it’s anybody’s guess right now.
That’s the sentiment across retail right now—fatigue, frustration, and futility. It’s not that traders can’t read charts. It’s that every time something starts to look bullish, it suddenly turns sour. Good earnings get sold. Breakouts get faded. Trends reverse overnight. And just when you think you’ve figured out the new playbook, the tape changes again.
But that’s the entire strategy.
This is what engineered volatility looks like. It’s how Wall Street uses monetary policy shifts and emotional news cycles to create the illusion of risk—masking accumulation beneath carefully timed supply shocks. That’s the rip current. And this is where it hits the shoreline—when macro fear collides with individual names and creates the perfect conditions for reaccumulation.
We’ll start with META and AMZN—two of the most sentiment-sensitive names in tech. Both have seen their structures weaponized during this cycle. Both have absorbed massive institutional flow while the crowd second-guessed every move. And both are now showing the downstream effects of everything we laid out in Section 2.
META – A Perfect Storm of Fear and Flow

📊 Chart – META (Late 2023): Post-Hike Confusion and Sentiment Shakeout
This is where the current collided with the coast. As fears of another rate hike dominated the headlines, META slipped into a volatility trap. Retail pulled back. Analysts warned of exhaustion. The crowd went defensive. And just beneath the surface, Wall Street got to work.
The structure is textbook. A healthy markup into a reaccumulation range. A false breakdown into a spring. And a massive spike in demand that breaks the range with conviction. This isn’t random—this is orchestrated. It’s how institutions accumulate without competition.

📊 Chart – META (Mid 2024): Reaccumulation Confirmed with Structural Continuation
The breakout didn’t just reclaim trend—it reset the entire tape. Volume exploded. RSI surged. And price never looked back. That’s not retail—it’s rotation. And it’s exactly what we’ve been teaching: when the narrative screams caution, watch what structure does instead.
META isn’t the exception. It’s the example. And this is how you trade the rip current—by letting it carry you into setups the crowd can’t see yet.
AMZN – Institutional Demand Beneath Disbelief

📊 Chart – AMZN (Early 2024): Fear-Driven Pullback and the Spring Setup
This is what fear looks like on a chart. A clean advance gets clipped by headlines about inflation, regulation, and recession risk. The pullback accelerates. RSI breaks. And retail starts to bail—just as AMZN enters the sweet spot for reaccumulation.
The structure doesn’t lie. Volume surges at the lows. Price springs the range. And what looks like a breakdown becomes an invitation. Institutions aren’t reacting to the narrative—they’re exploiting it.

📊 Chart – AMZN (May 2025): Breakout, Retest, and Markup Resumption
The breakout is fast and definitive. The backtest is shallow and quiet. And now AMZN is making higher highs on strong volume and improving momentum. This is the institutional blueprint: accumulate under duress, confirm on reclaim, and ride markup while retail debates headlines.
📌 Supply, Demand, and the Rip Current’s Edge
This is the final stop in our metaphor. We showed how the rip current forms beneath surface volatility aiding the institutional business cycle. Then revealed how monetary policy weaponizes that current. But here, reviewing supply v. demand, we see the impact—how engineered fear introduces supply, flushes weak hands, and leaves the shoreline clean for institutional demand.
META and AMZN are just two examples. But they follow the same playbook. As rate shocks and policy pivots pull retail off balance, Wall Street waits beneath the froth—ready to reload. And when the tide turns, the breakout won’t be the surprise. The real surprise will be how early Wall Street was already positioned.
The next move won’t look safe—but structure says it’s already underway.
Disclaimer: Trade Therapy, L.L.C. content is intended for US recipients only and is not directed at UK recipients. Our information and analysis do not constitute an offer or solicitation to buy any security and are not intended as investment advice. Content should be used alongside thorough due diligence and other sources. Opinions and analyses are those of the author at the time of publication and may change without notice. Trade Therapy, L.L.C. and its employees may move in or out of any trades detailed within our content at any time at their discretion. Employees and affiliates of companies mentioned may be customers of Trade Therapy, L.L.C. We strive for transparency and independence, and we believe our material does not present a conflict of interest. All content is for educational purposes only.
Headlines used for educational analysis under fair use; all rights reserved by original publishers
Leave a Comment
You must be logged in to post a comment.