Disclosures: This research is for educational purposes only and is not investment advice. Trading involves risk, including the risk of loss. Do your own work and manage risk according to your plan. Positions may change at any time.
Introduction — Lesson: From Base to Runway
When a long base matures, price doesn’t explode on command. It graduates into a runway, where controlled pullbacks and brief sentiment shocks help sponsors confirm that demand still outvotes supply. This week’s lesson focuses on recognising that graduation: how to read a base that is now serving as a staging area, and how to use pullbacks into known levels as opportunity rather than alarm. The headline whipsaw after the House vote was a reminder that the first reaction is not always the lasting one; the weekly tape still tells the story.
Index — SPY Weekly
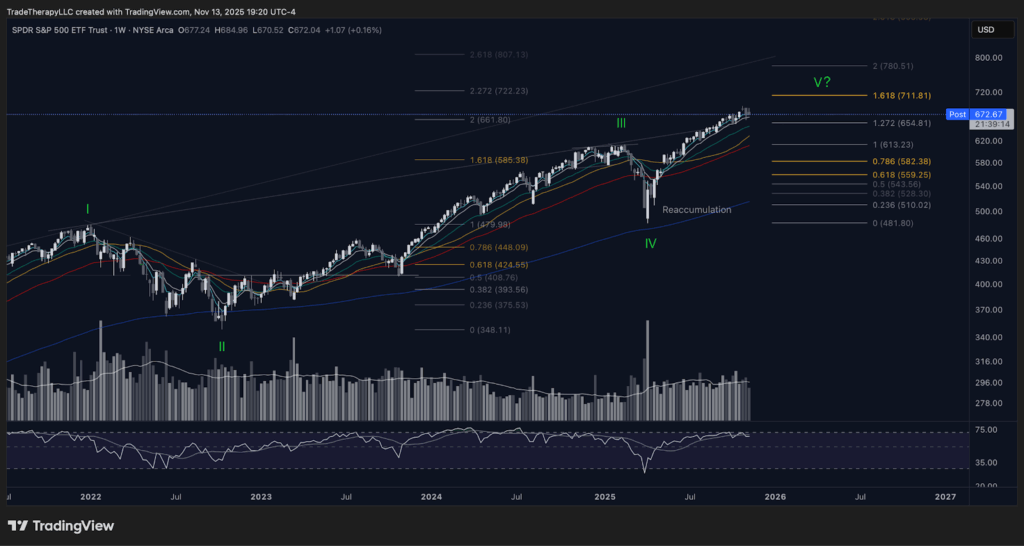
📊 Chart 1 – SPY (November 2025): Base graduates to runway near measured extensions: A year anchored by reaccumulation has advanced to controlled markup, with pullbacks testing readiness rather than breaking trend.
Institutions spent much of the past year converting a broad base into a workable runway. As price advanced, each giveback has served to test sponsorship rather than unwind the campaign. The latest weekly bar reflects a hard swing on policy headlines, yet the larger structure still sits inside a measured extension grid where campaigns typically slow, test, and refuel.
The immediate extension cluster now sits just overhead, reflecting where the prior leg’s measured rhythm completes. Price has already tested the round-number shelf defined by earlier projections. On the downside, the next checkpoints include the full retrace of the prior advance and, if volatility expands, a deeper Fibonacci confluence band from that same move. These are the areas where sponsors typically test participation, absorb inventory, and maintain control of the runway.
📜 Institutional Literacy:
Volume remains orderly relative to the surge periods that defined last year’s base. On the RSI panel, momentum cooled from elevated readings without the kind of persistent deterioration that typically precedes a full distribution top. That combination, orderly volume on tests and a moderated but intact momentum profile, is consistent with a runway phase rather than a blow-off or a topping roll.
Violent headline weeks are often used to test for weak hands at known checkpoints. The question isn’t “Did price drop,” it’s “Did that drop recruit meaningful supply at a level where sponsors wanted to check intent?”
📊 Chart 2 – SPY (November 2025): Daily retest defines the runway’s edge
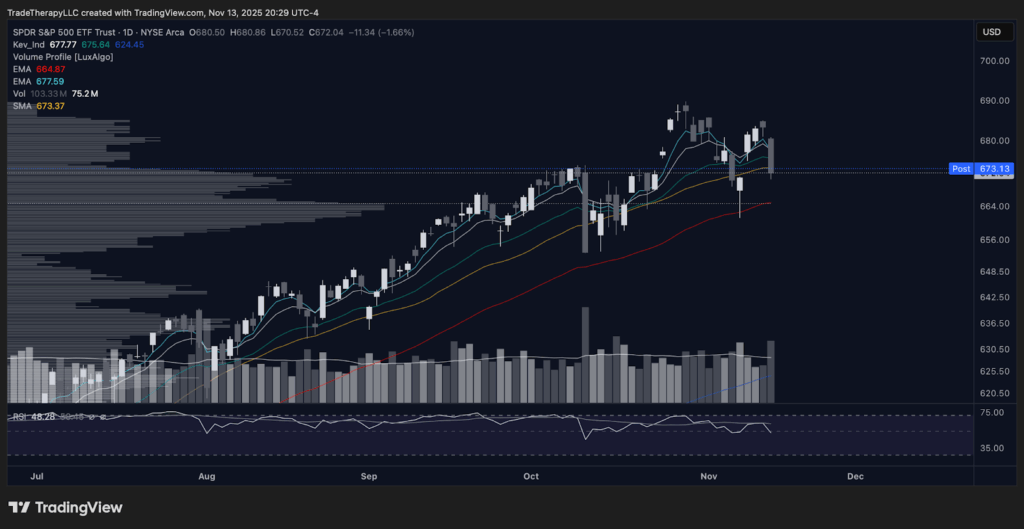
then → now: The daily chart has pulled back to verify the new floor at the recent breakout pivot, holding the structure of the weekly runway in place.
The daily tape mirrors what professionals expect when a base matures: brief dislocations that help confirm the foundation. This week’s volatility retraced directly back to the same short-term pivot that marked the prior breakout, where former resistance has turned into a functional platform. Volume expanded into that touch, an intentional test to gauge how much inventory remains.
The 9- and 21-day pair continue to orbit just above the 30-day band, keeping trend posture intact despite the headline shock. As long as the current support band on the daily chart continues to absorb selling, the market is validating that the broader campaign remains healthy. Price action inside this band represents a healthy refuel period before any new leg higher.
Momentum in the RSI panel softened, not collapsed—precisely the type of moderation sponsors want to see after a vertical advance. The short-term game is about digestion, not defense.
⚙️ Cycle Mechanics:
When a long base becomes a runway, tests like this replace fear with confirmation. The faster they recover, the more evidence we have that accumulation has already shifted into sponsorship.
🔑 Key Takeaways — SPY
- The pullback aligns with a clean backtest of former resistance, confirming the runway’s structural integrity.
- The 9/21-day pair remain supportive, with the 21–30-day band absorbing most of the week’s volatility.
- Volume expansion on the test, followed by contained downside, suggests professional absorption rather than distribution.
- RSI moderation signals a cooling phase before potential continuation.
Sector ETF — XLY Weekly
When we last discussed the Consumer Discretionary ETF in May, we highlighted a sharp breakdown into the lower end of its range that looked like failure to most traders and opportunity to institutions. The important clue wasn’t the price print, it was who was active. Volume surged as large accounts quietly rebuilt exposure to the sector’s biggest holdings while the RSI panel began to diverge from price.
📊 Chart 3 – XLY (May 2025): Spring converts a breakdown into reaccumulation
The May chart captured that moment: a hard move into the bottom of the range that flushed out weak holders, followed by a sharp recovery back inside the structure. That behavior is consistent with a spring, not a trend break. The rebound that followed didn’t explode to new highs; it moved methodically through a series of resistance shelves, pausing at each one to test how much supply remained. Institutions were using volatility to reload, not exit.
As the year progressed, that spring evolved into a proper runway.
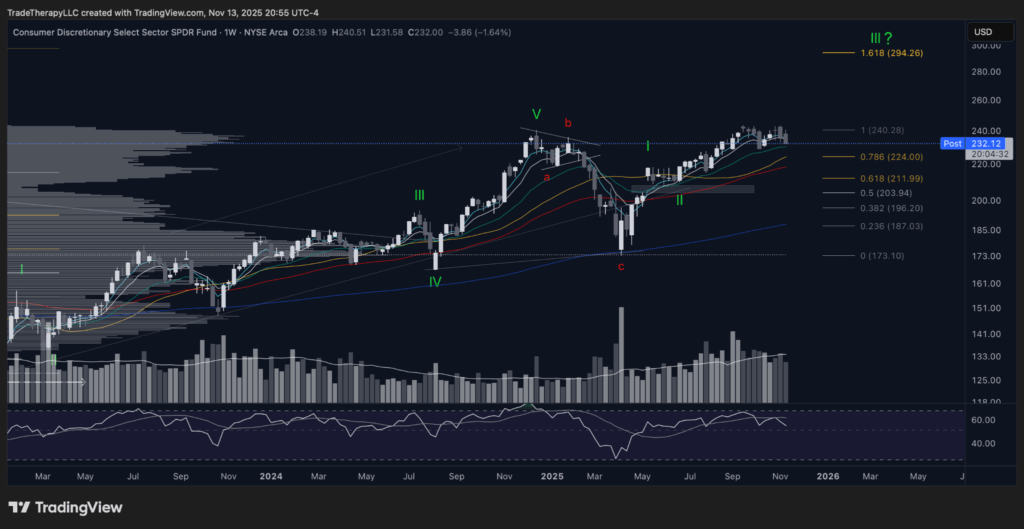
📊 Chart 4 – XLY (November 2025): Runway work inside a consolidation band beneath prior highs
The updated weekly chart shows XLY rotating in a clear corridor beneath its prior peak, with a visible consolidation band acting as the staging area for the next leg. Pullbacks into the lower half of that band have been bought repeatedly, while pushes toward the upper edge have been used to gauge participation rather than trigger a vertical breakout. Volume expands on tests of support and contracts on recoveries, a classic profile of ongoing accumulation inside a controlled range.
On the RSI panel, momentum cooled from its initial surge and has settled into a healthy mid-zone, consistent with a runway phase rather than a topping pattern. This is how institutions construct durability in the middle of a campaign: they trade time for confirmation, letting sponsorship deepen before they press for another extension.
📜 Institutional Literacy – Springs vs “Failed Breakdowns”
What looks like a failed breakdown to retail often functions as a spring for institutions. The move below support is designed to exhaust remaining sellers, pull in late shorts, and create the liquidity needed to rebuild size. The key tell is what happens after the break: fast recovery, firming volume on the way back into the range, and a willingness to defend the new band on future tests.
For DIS, the implication is straightforward. A discretionary sector that is willing to hold this corridor and defend its consolidation band is one where capital is being managed, not abandoned. That backdrop supports late-stage accumulation in individual names rather than broad de-risking.
🔑 Key Takeaways — XLY
- The breakdown we highlighted in May evolved into a spring and reaccumulation phase, not a structural failure.
- XLY now trades inside a clear corridor beneath its prior high, using that band as a runway rather than a ceiling.
- Pullbacks into the lower half of the band continue to attract sponsorship, confirming that institutions are still building rather than distributing.
- This sector behavior provides a constructive environment for DIS as it completes its own base.
Leadership — NFLX Monthly and Weekly
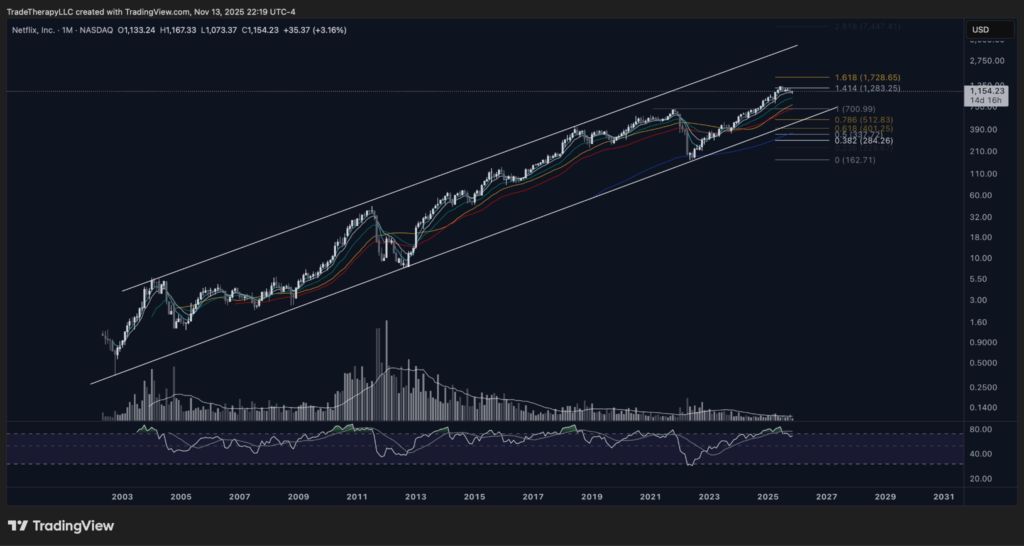
Netflix continues to function as the institutional anchor for the discretionary complex. It’s one of the few large-caps whose campaign discipline has survived multiple business-cycle turns. The long-term channel visible on the monthly chart has guided two decades of accumulation, profit-taking, and controlled resets — a visual record of how large operators manage capital through time rather than narrative.

📊 Chart 5 – NFLX (Monthly, November 2025): Long-term channel defines institutional tempo
The structure here isn’t about geometry for geometry’s sake; it’s a blueprint for professional patience. Every major pullback, including the 2022 markdown that headlines called a collapse, was simply a mid-channel retest that reset ownership. That correction provided liquidity to re-enter at scale, evidenced by the surge in participation into the lows. From there, the monthly averages realigned, confirming renewed sponsorship.
The channel shows why news rarely matches tape. Headlines react to momentum, but institutional programs are built around proportionality and time. The market’s narrative shifts faster than capital can rotate, so while stories change, the channel’s slope stays constant. This is what cycle literacy looks like — understanding that volatility serves maintenance, not reversal, inside a controlled campaign.
With that framework in mind, the weekly chart reveals how institutions express that same discipline tactically.
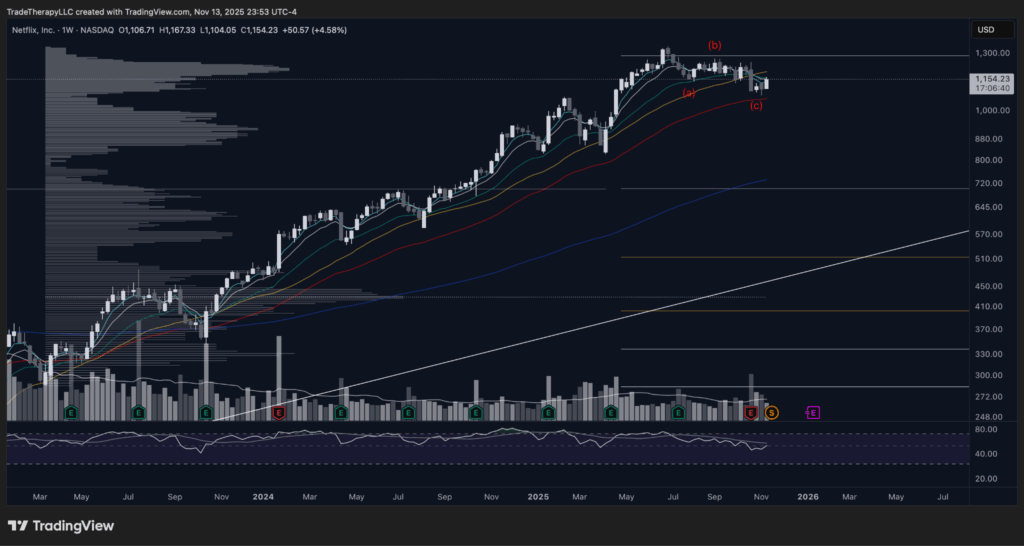
📊 Chart 6 – NFLX (Weekly, November 2025): Institutional defense at the 55-week EMA
Over the past several years, NFLX has lost its 55-week EMA only once, during the 2022 capitulation that defined the sector’s re-entry phase. Since then, the 55 has served as a line of control. Each time price approaches it, short-term sentiment collapses while sponsorship quietly rebuilds. Headlines turn bearish precisely where institutions reload.
The recent ABC correction followed that pattern. The (c)-wave decline touched the 55-week EMA, volume expanded to absorb selling, and price immediately stabilized. That isn’t chance; it’s inventory management. The moving average functions as a balance-sheet checkpoint. The level where managers verify demand and defend existing exposure.
The RSI panel reinforces the same logic. Momentum has cooled to neutral, not broken down, confirming that the pause is part of reaccumulation rather than distribution. As long as the 55-week EMA holds, the broader business-cycle campaign remains intact.
For DIS, this is instructive. Institutional defense at these levels by sector leaders like NFLX signals confidence in the discretionary cycle’s underlying health. When the leaders defend rather than distribute, secondary names are being readied for advancement.
🔑 Key Takeaways — NFLX
- The long-term channel reveals how institutions manage capital across decades, independent of news cycles.
- The 2022 markdown was a controlled mid-channel reset that reloaded sponsorship.
- The 55-week EMA serves as a recurring checkpoint where institutions confirm demand during each tactical correction.
- Volume and RSI behavior confirm reaccumulation, not exhaustion, preserving the sector’s stability and setting conditions for DIS to complete its own base.
Peer — SPOT
Spotify’s weekly chart offers a clear example of how professional campaigns manage volatility once the markup phase is underway. The structure across the past three years has followed the full institutional playbook: markdown, accumulation, then sustained markup. This week’s sharp pullback fits within that context and is already generating early signs of bullish divergence in the RSI panel, a classic footprint of sponsorship testing rather than liquidation.
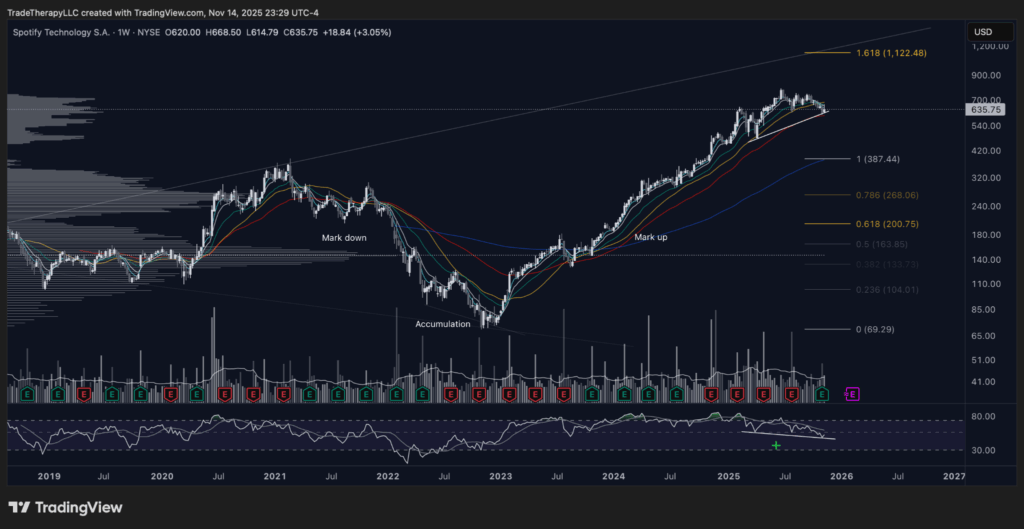
📊 Chart 7 – SPOT (Weekly, November 2025): Pullback produces bullish divergence inside an ongoing markup
What stands out is how volume behaved during this retracement. The surge into the week’s low did not carry the liquidation signature typically associated with distribution. Instead, it resembles a liquidity test: institutions shaking out reactive holders where prior sponsorship was established. The 9-, 21-, and 55-week averages remain in constructive hierarchy, preserving directional integrity.
Notice also how price continues to hold above the prior accumulation zone that supported the 2022 bottom. That base, once resistance, now serves as the depth gauge for demand. Each time SPOT has returned to this region over the past two years, institutional buyers have absorbed supply quickly. The emerging bullish divergence on the RSI panel reinforces that what just occurred is more consistent with maintenance than breakdown.
The daily view sharpens that message by showing exactly how the correction has been structured.
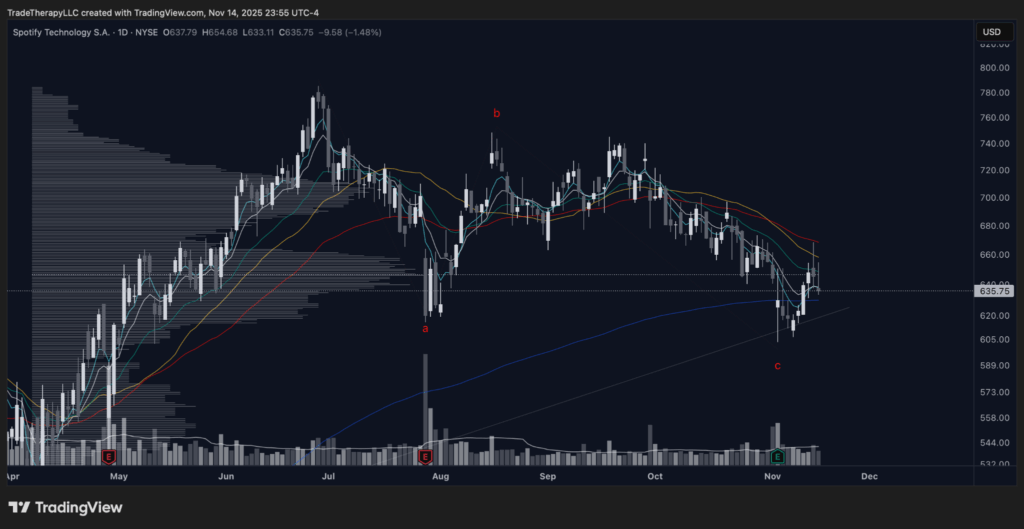
📊 Chart 8 – SPOT (Daily, November 2025): Tactical ABC test inside a higher-timeframe markup
The daily chart resolves this pullback as a measured ABC correction rather than a disorderly slide. The “c” leg undercut prior short-term support, attracted a spike in volume, and then reversed back into the reclaimed range. That pattern is consistent with a deliberate liquidity test: sponsors drive price into a known demand pocket, measure who is willing to sell, and then stabilise the tape once weak hands have been flushed. The 9/21-day pair is beginning to curl under price again, signalling that the immediate shock is being absorbed rather than extended.
⚙️ Cycle Mechanics – Corrective waves vs. trend failure
For retail traders, a three-leg decline often feels like the start of a new downtrend. Institutions read it differently. Inside a confirmed markup, an ABC sequence is usually a maintenance pattern that resets positioning and sentiment without violating the larger campaign. The tell is where it happens and how it resolves: tests into prior demand with quick reclaim and improving momentum belong to Phase D markup, not to a new markdown.
The educational takeaway is straightforward: sharp pullbacks inside a confirmed markup tend to function as campaign maintenance rather than reversal. Professionals use volatility to measure conviction, re-engage participation, and reload inventory without expanding cost basis. Retail sentiment often interprets the same event as exhaustion, which is why headlines mislabel these phases as trend breaks.
🔑 Key Takeaways — SPOT
- The weekly pullback carried maintenance traits, not distribution characteristics.
- The long-term accumulation base continues to act as sponsorship depth rather than overhead supply.
- The daily ABC correction aligns with bullish divergence, reinforcing that institutions are testing, not exiting.
- Moving-average hierarchy on both weekly and daily timeframes confirms that the broader markup campaign remains intact.
Laggard/Value Peer — PSKY Weekly and Close-Up
The long-term PSKY structure teaches the same lesson we’ve been tracing all year: every markup phase begins quietly, long before the narrative changes. Paramount Skydance’s all-time chart shows a full five-wave Elliott structure concluding in 2021’s hypodermic distribution, followed by a deep markdown that erased more than a decade of gains. But where retail investors saw collapse, institutions saw clearance.
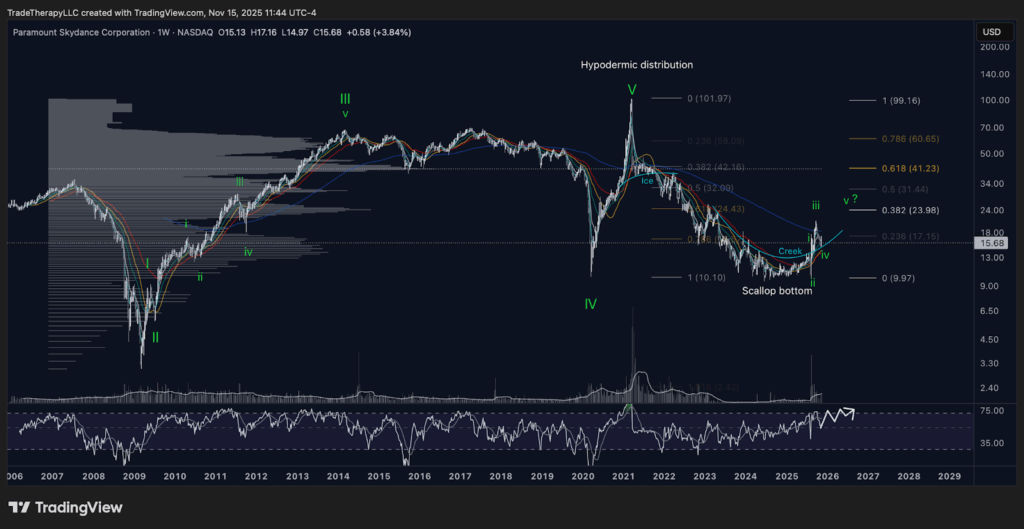
📊 Chart 9 – PSKY (All-Time Weekly): A complete Elliott cycle resetting for reaccumulation
The decline into 2023 resolved through a distinctive scallop bottom—a rounded, time-based repair pattern that often forms when institutions reenter after capitulation. The shape itself reflects the gradual transition from panic to control: sellers are exhausted, liquidity becomes thin, and small surges in volume begin to lift price along a gentle curve. In Elliott terms, this corresponds with the tail end of Wave IV and the birth of a new impulsive sequence.
What makes this structure especially instructive is its alignment with Wyckoff logic. The scallop base is essentially the “cause” portion of the accumulation schematic: demand begins to show, but it takes time for large buyers to accumulate without driving price prematurely. Each dip beneath short-term averages serves as a liquidity test, shaking out residual supply and refueling the next advance.
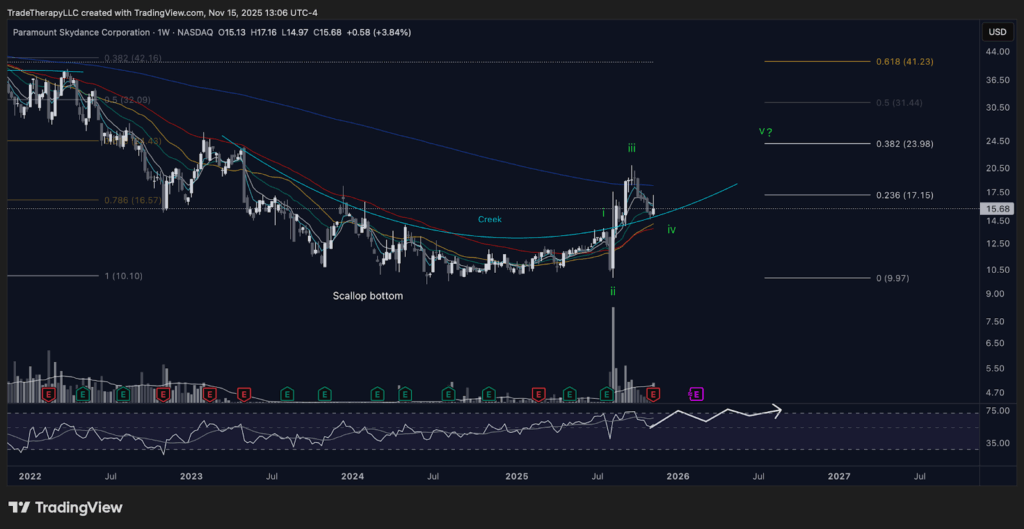
📊 Chart 10 – PSKY (Weekly Close-Up, November 2025): Accumulation turns to early markup
In the close-up view, PSKY’s recent behavior confirms that interpretation. The breakout above the “creek” line in mid-2025 established the first impulsive wave of a new cycle. The recent retracement toward that same level—now labeled Wave IV within the smaller sequence—is the kind of controlled backtest that institutional campaigns depend on to verify sponsorship. Volume has remained disciplined, and the RSI panel is holding above the 50 line, showing the transfer of ownership is steady, not panicked.
⚙️ Cycle Mechanics: The Scallop Bottom
In Japanese candlestick theory, the scallop bottom represents the psychological mirror of institutional accumulation. It’s not a V-shaped reversal—it’s a negotiation. Supply is progressively absorbed until price can sustain higher lows. In Wyckoff language, this is the transition from Phase C (the spring) into Phase D (markup). Professionals use this phase to accumulate without alerting the crowd, while headlines still reflect skepticism.
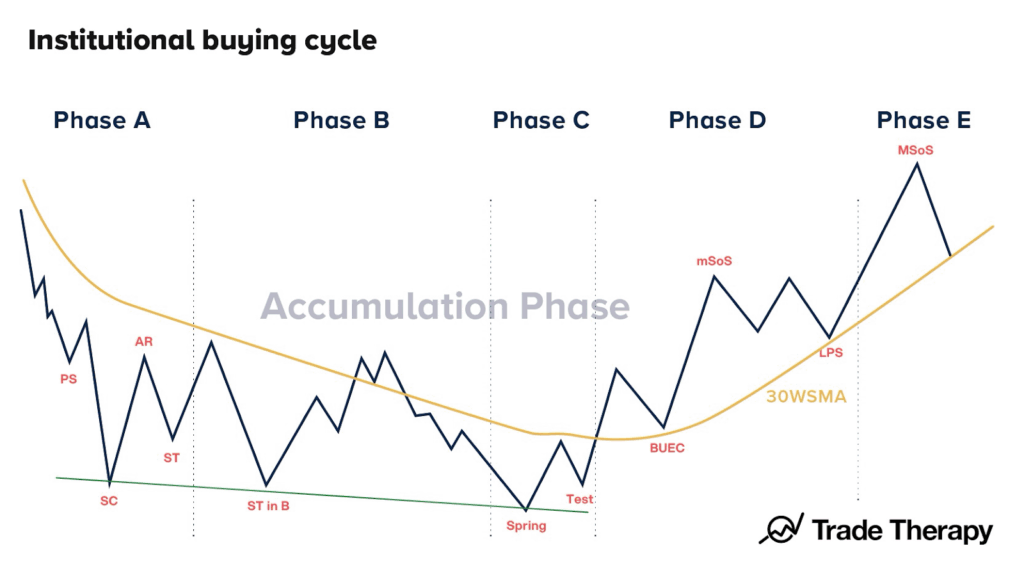
Graphic 1 – Institutional Buying Cycle
🔑 Key Takeaways — PSKY
- The scallop bottom shows how institutions build inventory quietly over time, forming the cause for the next markup.
- The Elliott count and RSI confirm early impulse conditions within a larger reaccumulation base.
- The retest of the creek validates new sponsorship and confirms control remains with buyers.
- This laggard’s transition from base to markup signals deep value rotation within the discretionary complex.
Top-Down Summary
Across this week’s sequence: SPY, XLY, NFLX, SPOT, and PSKY, the institutional roadmap is remarkably consistent. Indices and sector ETFs are completing the same base-to-runway progression we’ve been teaching all year: compression, testing, and controlled lift. Leadership (NFLX) is holding markup while mid-tier peers (SPOT) test demand and value laggards (PSKY) rebuild sponsorship.
Each stage reveals a different tempo of the business cycle. SPY and XLY define the environment, showing that broad risk appetite is still constructive. NFLX illustrates disciplined markup management. SPOT demonstrates tactical reaccumulation beneath resistance. PSKY captures the first stirrings of long-term accumulation rotating into value. Together, they signal that Wall Street is preparing for the next leg of discretionary expansion.
What This Means To You
When we turn to Disney, we’ll be looking for evidence that it’s completing this same process—late-stage accumulation transitioning into markup. The difference is maturity: while PSKY is in early expansion, DIS appears ready for ignition. Its long-term base shows the same scallop curvature, but with tighter compression and larger volume sponsorship. If confirmed, that shift would mark the point where media-sector accumulation graduates into full markup.
What we’ll watch for next:
- Volume confirmation on any breakout above prior range highs.
- RSI rotation through the 60 line, validating demand control.
- Defense of the 21–30-day band, which would signal readiness for trend extension.
Featured Analysis — The Walt Disney Company (DIS)
When we last covered Disney in Q2 2024, the story was about patience – the kind that defines institutional campaigns rather than speculative trades. At that point, the stock had been coiling within a mature accumulation range for nearly two years. The headline narrative still focused on revenue pressure and streaming losses, but the tape was already saying something else: liquidity was being absorbed, not abandoned.
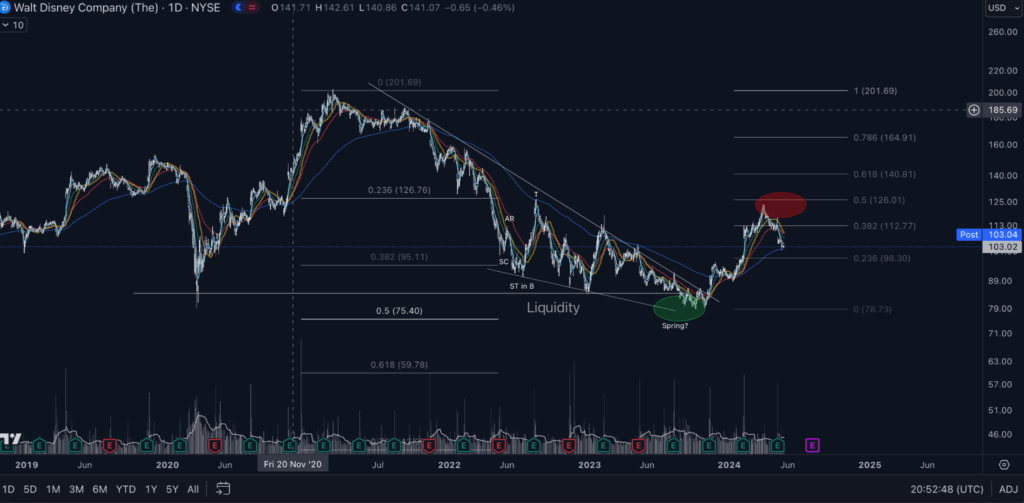
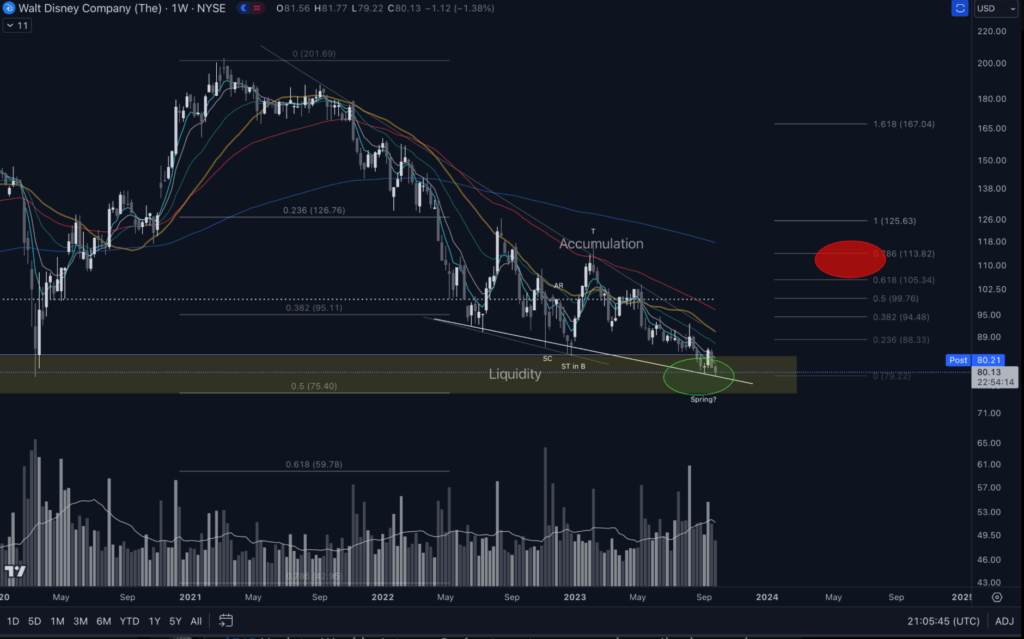
📊 Chart 11 – DIS (Weekly, 2024 Lookback): The spring event emerges from deep accumulation
Between Q3 2023 and Q1 2024, DIS completed a full Wyckoff schematic. The Selling Climax (SC), Automatic Rally (AR), and Secondary Test in Phase B defined the bounds of accumulation. The late-2023 spring through 75 marked the emotional low, where institutions harvested liquidity from capitulating holders. That shakeout wasn’t weakness, it was procurement.
As the stock reclaimed the broken downtrend in early 2024, volume expanded and the 30-week SMA flattened, signaling equilibrium between supply and demand. Each successive rally leg carried cleaner breadth and smaller pullbacks, a classic footprint of early markup behavior inside a developing institutional campaign.

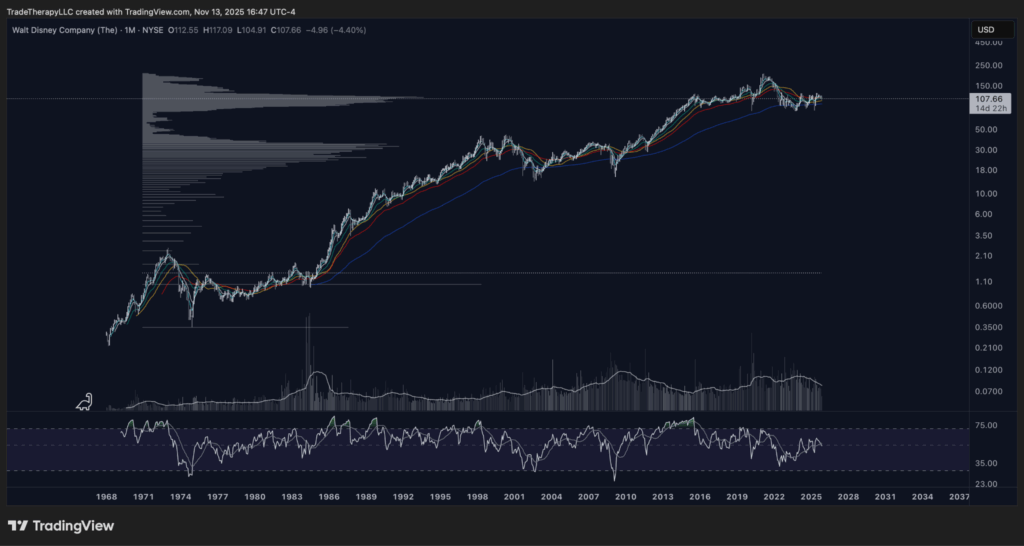
📊 Chart 12 – DIS (All-Time Monthly): A half-century of accumulation culminating in institutional base construction
The all-time view reveals how deliberate Disney’s structural development really is. The consolidation that began in 2021 is the deepest and longest since the mid-1980s — a generational base forming atop decades of compounded markup. Volume distribution across the left side of the profile shows heavy sponsorship from long-term capital that hasn’t been liquidated, only rotated.
This is what large-scale accumulation looks like when seen through an institutional lens: time replaces volatility as the mechanism of value transfer. Instead of vertical capitulation, Disney’s correction evolved into a horizontal campaign of absorption. The RSI panel confirms this, holding in a mid-range equilibrium for three years — neither oversold nor overbought — while ownership quietly transitions from reactive to strategic hands.
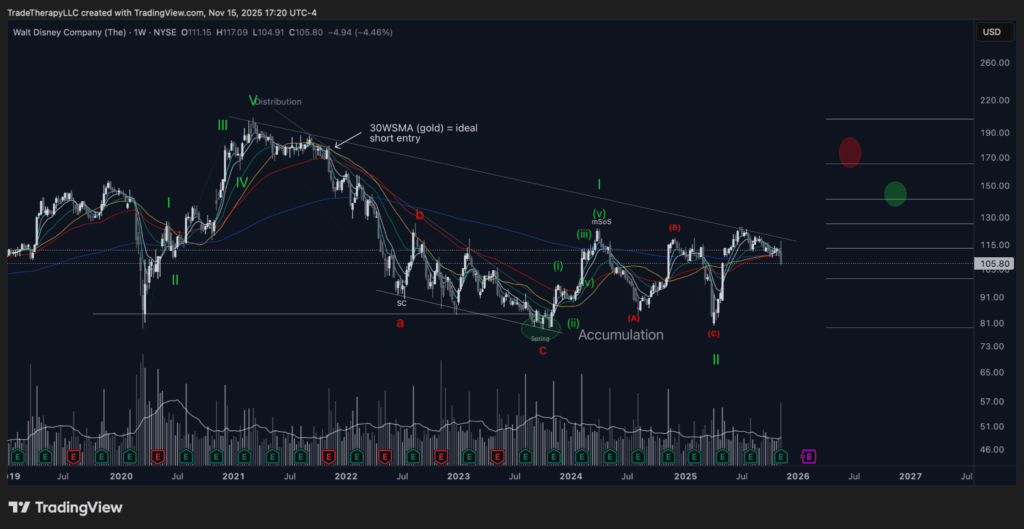
📊 Chart 13 – DIS (Weekly, November 2025): Late-stage accumulation transitioning toward markup
On the current weekly, Disney continues to respect the same structural logic. Price is now trading above its prior creek line, testing it repeatedly with shrinking volume — a signature of supply exhaustion. The 9- and 21-day EMAs remain aligned upward, while the 55-week EMA flattens beneath. Even during this autumn’s volatility, the tape held each retest cleanly inside the 80–85 zone, showing that control remains with institutions, not short-term traders.
This phase , the quiet defense of reclaimed ground, is where markup readiness is confirmed. Every successful backtest adds conviction and builds a tighter spring for the next impulse.
Featured Analysis — Summary
Disney is now behaving like a campaign that has moved from survival to stewardship. The selling climax, spring, and creek reclaim are behind us. What remains is a stock that has spent years letting institutions reprice it horizontally while the narrative cycled from euphoria to despair and back to indifference. That is exactly where late-stage accumulation does its best work.
Across the weekly and monthly views, the message is consistent. Liquidity has been harvested, volatility has cooled, and each test into the base is attracting less aggressive selling. The longer Disney dwells above its liquidity shelf and beneath the overhead supply band, the more evidence we have that large buyers are no longer negotiating ownership. They are managing it. That is the inflection point where a base stops being a question and starts functioning as a runway.
Viewed in the context of SPY, XLY, NFLX, SPOT, and PSKY, Disney looks less like a turnaround story and more like a mature expression of the same discretionary cycle. The index and sector have already proven that sponsors are willing to defend risk. Leaders like NFLX are maintaining markup. SPOT and PSKY are still in earlier phases of their campaigns. Disney sits where those paths converge: a fully built base that is now being tested for launch rather than survival.
Why it matters
- It reframes Disney from “cheap stock with baggage” to “mature campaign entering its payoff phase.”
- It shows members how a full Institutional Buying Cycle looks at the point where patience is about to be rewarded, not tested.
- It gives a concrete template for future trades: identify the spring, watch the creek reclaim, then study how sponsors defend the runway before markup.
Bullish Scenario
The bullish path is supported by everything we’ve discussed: a completed Wyckoff schematic, strong defense of the 80–85 liquidity shelf, and advancing moving averages that confirm early markup behavior. As price continues to respect the rising 9- and 21-week EMAs, the probability increases that institutions are preparing to push the next leg of the campaign.
A decisive reclaim of the 105–110 zone would confirm renewed sponsorship and open the door to 126 (the .5 retracement from the prior markdown) followed by 140–150 as the primary profit-taking range. These levels also align with historic resistance where late-stage distribution unfolded in 2021–2022.
The key to validating this scenario isn’t speed, it’s sponsorship. The healthiest confirmation will come from shallow, low-volume pullbacks and continued EMA alignment, indicating that the same large buyers responsible for the base are still in control.
Bearish Scenario
The bearish case rests on one premise: that the late-2024 advance was only an extended automatic rally and that the base remains incomplete. A sustained breakdown beneath 80, particularly with expanding volume, would confirm a failure of the spring and return the chart to a redistribution phase.
In that outcome, price could retrace toward 70, where deeper value buyers may defend again. A close below 70 would negate the current accumulation thesis entirely and suggest that the entire structure since 2022 was corrective rather than preparatory.
Even then, the long-term monthly profile provides a cushion: the 0.618 retracement sits near 60, which represents the final line of defense from a multi-decade perspective. Institutional ownership remains heavy there, meaning any decline into that zone would likely be temporary, marked by large-volume absorption.
It’s important to understand that both paths exist within the same institutional playbook. In strong campaigns, markup doesn’t occur in straight lines — it develops through alternating phases of reaccumulation and test. The purpose of the test is to identify who still owns weak inventory. Whether this resolves immediately or after one more consolidation, the structure continues to signal that smart money is preparing for a larger advance, not liquidating into one.
Trade Considerations
These are our thoughts on entering or managing our trades at the time of publication and are intended to be educational. Do not consider these considerations to be personal financial advice.
Trade Considerations — SPY
| Bias | Constructive; base-to-runway transition remains valid while price holds above 664. |
| Institutional Positioning | Using volatility to accumulate inventory near prior resistance turned support (~673). |
| Trend Health | Daily trend posture positive; short-term EMAs remain aligned and constructive. |
| Entry Levels | Scale entries on controlled retests toward 673; secondary opportunity if 664 holds after further tests. |
| Cascading Stops | First risk cut below 664; deeper stop beneath the prior volume-shelf low. |
| Rotation Watch | Watch XLC, NFLX, SPOT, and PSKY for confirmation of renewed sponsorship breadth. |
Trade Considerations — XLY
| Bias | Constructive while price holds the current consolidation band. |
| Institutional Positioning | Large accounts accumulating on tests of the lower half of the range and rotating risk within the sector rather than exiting. |
| Trend Health | Weekly structure healthy, with pullbacks contained inside the established corridor and momentum stable in the RSI panel. |
| Entry Levels | Prefer scaling on controlled dips into the lower band of the range, with confirmation adds if price begins to spend more time near the upper edge of the corridor. |
| Cascading Stops | For tactical exposure, manage risk just below the lower edge of the consolidation band; structural risk only if the entire range fails and weekly closes begin to build beneath it. |
| Rotation Watch | NFLX, SPOT, PSKY, and DIS for confirmation that discretionary flows remain coordinated. |
Trade Considerations — NFLX
| Bias | Constructive while the 55-week EMA holds. |
| Institutional Positioning | Sponsors defending long exposure at the 55-week EMA; managing inventory through rotation, not liquidation. |
| Trend Health | Monthly and weekly hierarchies intact; 9 > 21 > 55 alignment remains. |
| Entry Levels | Scale entries on controlled tests of the 55-week EMA; breakout participation only above prior wave-b highs. |
| Cascading Stops | Tactical risk cut just below the 55-week EMA; structural cut below the 2024 swing low. |
| Rotation Watch | SPOT, PSKY, and DIS for confirmation that leadership defense is broadening through the discretionary complex. |
Trade Considerations — SPOT
| Bias | Constructive while above the prior accumulation shelf. |
| Institutional Positioning | Sponsors defending exposure near 620–640; adding through the 21- to 30-day band. |
| Trend Health | 9/21-day pair positive; weekly hierarchy intact. |
| Entry Levels | Scale entries on tests into 620–640; confirmation add on daily close above short-term swing high. |
| Cascading Stops | Initial cut below 600; deeper stop below 527. All out below 500. |
| Rotation Watch | DIS, NFLX, PSKY for confirmation that content and media flows remain synchronized. |
Trade Considerations — PSKY
| Bias | Constructive while above the scallop-bottom base. |
| Institutional Positioning | Accumulation through the 14–17 zone; controlled backtest underway. |
| Trend Health | 9/21-week pair constructive; 55-week smoothing beneath price; RSI > 50. |
| Entry Levels | Add on weakness near 15; confirmation add above 18 with volume. |
| Cascading Stops | Tight risk cut below 14; structural stop below 10. |
| Rotation Watch | DIS, SPOT, and NFLX for confirmation of synchronized media-sector markup. |
Trade Considerations — DIS
| Bias | Constructive; maturing accumulation turning to markup. |
| Institutional Positioning | Campaign established; defended 80–85 zone, adding through 95–105. |
| Trend Health | 9/21-day pair positive; 55-week flattening; volume light on pullbacks. |
| Entry Levels | Scale entries near 80–85; confirmation add above 105 with volume. |
| Cascading Stops | Tactical stop below 75 (spring low); structural stop below 70. |
| Rotation Watch | NFLX and SPOT for leadership continuity within discretionary media. |
Featured Trade Sequence — DIS
Disney’s trade sequence is a clean example of how institutional campaigns unfold across timeframes, from the tactical spring to the long-term markup transition. It encapsulates the entire Institutional Buying Cycle in motion.
📊 Chart 14 – DIS (Daily): The spring and the first impulsive leg of markup
The daily view captures where the campaign turned. After an extended markdown, the spring in late 2023 confirmed exhaustion of supply. Volume spiked as price undercut support, then reversed sharply, classic Phase C behavior. The following months produced a five-wave advance off the low, aligning with the early markup of a new institutional cycle. Each pullback into the 9/21-day pair was absorbed quickly, showing how large players reloaded on weakness rather than chasing strength.
As retail focus stayed fixed on earnings headlines, professionals quietly rotated capital underneath — exploiting the liquidity that fear provided. This is how the best trades begin: when volatility hides accumulation.

📊 Chart 15 – DIS (Weekly, 2024 Lookback): Reclaiming control through accumulation and testing
Zooming out to the weekly timeframe, we see how that daily reversal fit within the larger schematic. The Selling Climax (SC), Automatic Rally (AR), and Secondary Test in B were all complete by mid-2023, and the late-year spring finalized Phase C.
Through Q1 2024, price coiled above the liquidity zone near 75–80 while the 21- and 30-week averages began turning upward. Volume behavior was textbook: expansion on rallies, contraction on pullbacks. This is the language of control, it tells us supply was no longer dictating price.
Each successful retest of the base reinforced institutional ownership, and by Q2 the chart began to express markup behavior. The red zone around 115–120 represents the next area of historic supply where distribution had occurred in 2022; it now serves as the target region for Phase D confirmation.
📊 Chart 16 – DIS (All-Time Monthly): Institutional campaigns built over decades
The all-time monthly puts Disney’s current setup into context. Every major consolidation in its history – 1970s, 2000s, 2020s – has ended the same way: extended time-based accumulation followed by a multi-year markup. The present base is the largest horizontal structure since the 1980s and sits atop a 40-year uptrend. The RSI panel reinforces the theme of equilibrium: repeated mid-range resets as institutions rotate holdings rather than exit.
What this teaches members is that professional capital doesn’t chase impulsive spikes — it builds time over level. The current consolidation isn’t indecision; it’s preparation for the next long-term expansion phase.
The Institutional Lesson
When viewed together, these three charts form the blueprint of a full accumulation-to-markup transition:
- Chart 14 (Daily) – The spring and early impulsive leg show where smart money begins accumulation under fear.
- Chart 15 (Weekly) – Reaccumulation and the successful test of demand confirm the base’s integrity.
- Chart 16 (Monthly) – The multi-decade geometry shows how those same tactics scale to generational horizons.
This is what the Institutional Buying Cycle looks like when it’s complete and why patience, not prediction, remains the edge.

Graphic 1 – Institutional Buying Cycle (Trade Therapy)
Final Thoughts
When we step back from the headlines and price noise, Disney’s evolution over the past three years illustrates how institutional accumulation looks in real time. The transition from despair to defense is rarely obvious to retail traders because it happens during periods of boredom, frustration, and disbelief, precisely when professionals are most active.
The evidence is clear: a completed schematic, tightening ranges, volume contraction on pullbacks, and higher-timeframe averages beginning to flatten and turn. These are not signs of liquidation. They’re the hallmarks of capital anchoring, where ownership transitions quietly and efficiently before the next markup phase begins.
From a psychological standpoint, this is the phase that tests conviction. The stock appears lifeless to those seeking instant gratification, but this is where wealth is built. Every successful backtest of the 80–85 zone deepens institutional conviction and compresses volatility, forming the energy required for expansion.
For members, the key takeaway is simple: learning to identify where patience pays more than prediction. Disney is demonstrating how professional operators construct campaigns that outlast macro headlines and emotional sentiment. When viewed through the lens of the Institutional Buying Cycle, this isn’t a stock that’s “stuck” – it’s one that’s charging.
Consulting Hours
10a-2p PDT Mondays & Tuesdays, $150/30 mins. Email: contact@tradetherapyllc.com.
Welcome New Members!
Check The Basics for chart help, welcome aboard!
Video:
Disclaimer: Trade Therapy, L.L.C. content is intended for US recipients only. Our information and analysis do not constitute an offer or solicitation to buy any security and are not intended as investment advice. Content should be used alongside thorough due diligence and other sources. Opinions and analyses are those of the author at the time of publication and may change without notice. Trade Therapy, L.L.C. and its employees may move in or out of any trades detailed within our content at any time at their discretion. Employees and affiliates of companies mentioned may be customers of Trade Therapy, L.L.C. We strive for transparency and independence, and we believe our material does not present a conflict of interest. All content is for educational purposes only.
Headlines used for educational analysis under fair use; all rights reserved by original publishers.