
Introduction
The ceremony changes the story. The tape shows what it left behind.
Xi Jinping’s state visit arrived with the kind of optics markets are built to notice: high-level diplomacy, a trade truce extended into 2027, and no major breakthroughs beyond that extension. BABA, FXI, and YINN/YANG still finished the week lower. That contrast is useful because summit weeks create attention and participation, which gives larger investors more liquidity to adjust exposure without revealing their intent through one isolated headline. The ceremony can change the story around a trade very quickly. The tape still has to show whether that attention leaves behind stronger demand, heavier supply, or simply another round of positioning inside an existing campaign.
The broader complex is split. Emerging markets are operating at new highs while the China layer has spent months backtesting its lows. FXI’s c leg reached the April 2025 low and is now trying to establish a higher low beneath compressed weekly averages. FUTU has reclaimed 102.54 and is working through the next stage of its repair. JD remains pinned beneath supply, while leveraged participation is still trying to recover its trend layers. The group has completed meaningful corrective work, but the evidence of renewed expansion is uneven.
BABA sits at the center of that test. Wave I ended sooner than expected, and Wave II ran deeper than expected before ending at 91.99 on the 0.618 retracement of Wave I. That depth fits the way an accumulation campaign can clear a crowded markup: price keeps backtesting until available supply stops producing further downside and demand finally answers. BABA has since recovered and is now back on the first repair level at 109.53, where the first pullback after Wave II is testing whether buyers can retain recovered ground.
The live question over the coming weeks is whether China can turn completed corrections into promoted higher floors while the broader emerging-market backdrop stays supportive. FXI needs a durable higher low, the stronger names need to keep what they recovered, and BABA needs to absorb the supply released during its first rebound without reopening 91.99. If demand meets those tests, the campaign can begin rebuilding toward expansion. If it does not, the backtest still has room to run before the market settles who owns the next leg.
Selling pressure exhaustion is the point in a decline where additional supply stops producing meaningful downside. Price may still be near its lows, but the relationship between selling effort and result has changed. Each new attempt to push lower becomes less effective because fewer sellers remain willing or able to continue feeding the decline.
Exhaustion can arrive through two different routes. Climactic exhaustion concentrates the final selling into a burst of participation, with a volume spike absorbing the last forced supply. FUTU’s labeled Shakeout shows that route. Quiet exhaustion develops as participation contracts through the decline until selling can no longer move price with the same efficiency. BABA’s Wave II shows the quieter version. One ends with a surge in activity, the other with supply gradually drying up, but both describe the same underlying condition: selling pressure has stopped producing the result it once did.
Institutions accumulating size do not need a correction to stop where the public expects it to stop. Their concern is whether enough supply has changed hands for the next phase of the campaign to develop. As long as selling continues to produce useful liquidity, the backtest can keep running. It ends when demand becomes strong enough to absorb what remains and further selling loses its ability to drive price materially lower.
That is why a correction can run deeper and finish sooner than projected while still remaining consistent with accumulation. Depth alone does not tell us whether the campaign failed. The better evidence comes from the ending: whether selling effort expands or contracts, whether downside progress becomes harder to produce, whether demand finally interrupts the decline, and whether the first recovery can survive its next pullback.
The consequence is important for how a correction is managed. An expected support area is a reference, not a promise about where the market has to turn. When price continues lower, the job is to observe whether the decline is gaining professional supply or exhausting the sellers already trapped inside it. Once demand answers, the analysis shifts again. The question becomes whether buyers can retain what they recovered and begin promoting higher floors.
BABA is now in that second test. Wave II has already shown how far a backtest can travel before demand responds. The weeks ahead will show whether that response was strong enough to begin rebuilding the campaign or whether the market still needs more time before the next sustained advance can develop.
Top-Down Analysis
Emerging markets at highs, China still backtesting.
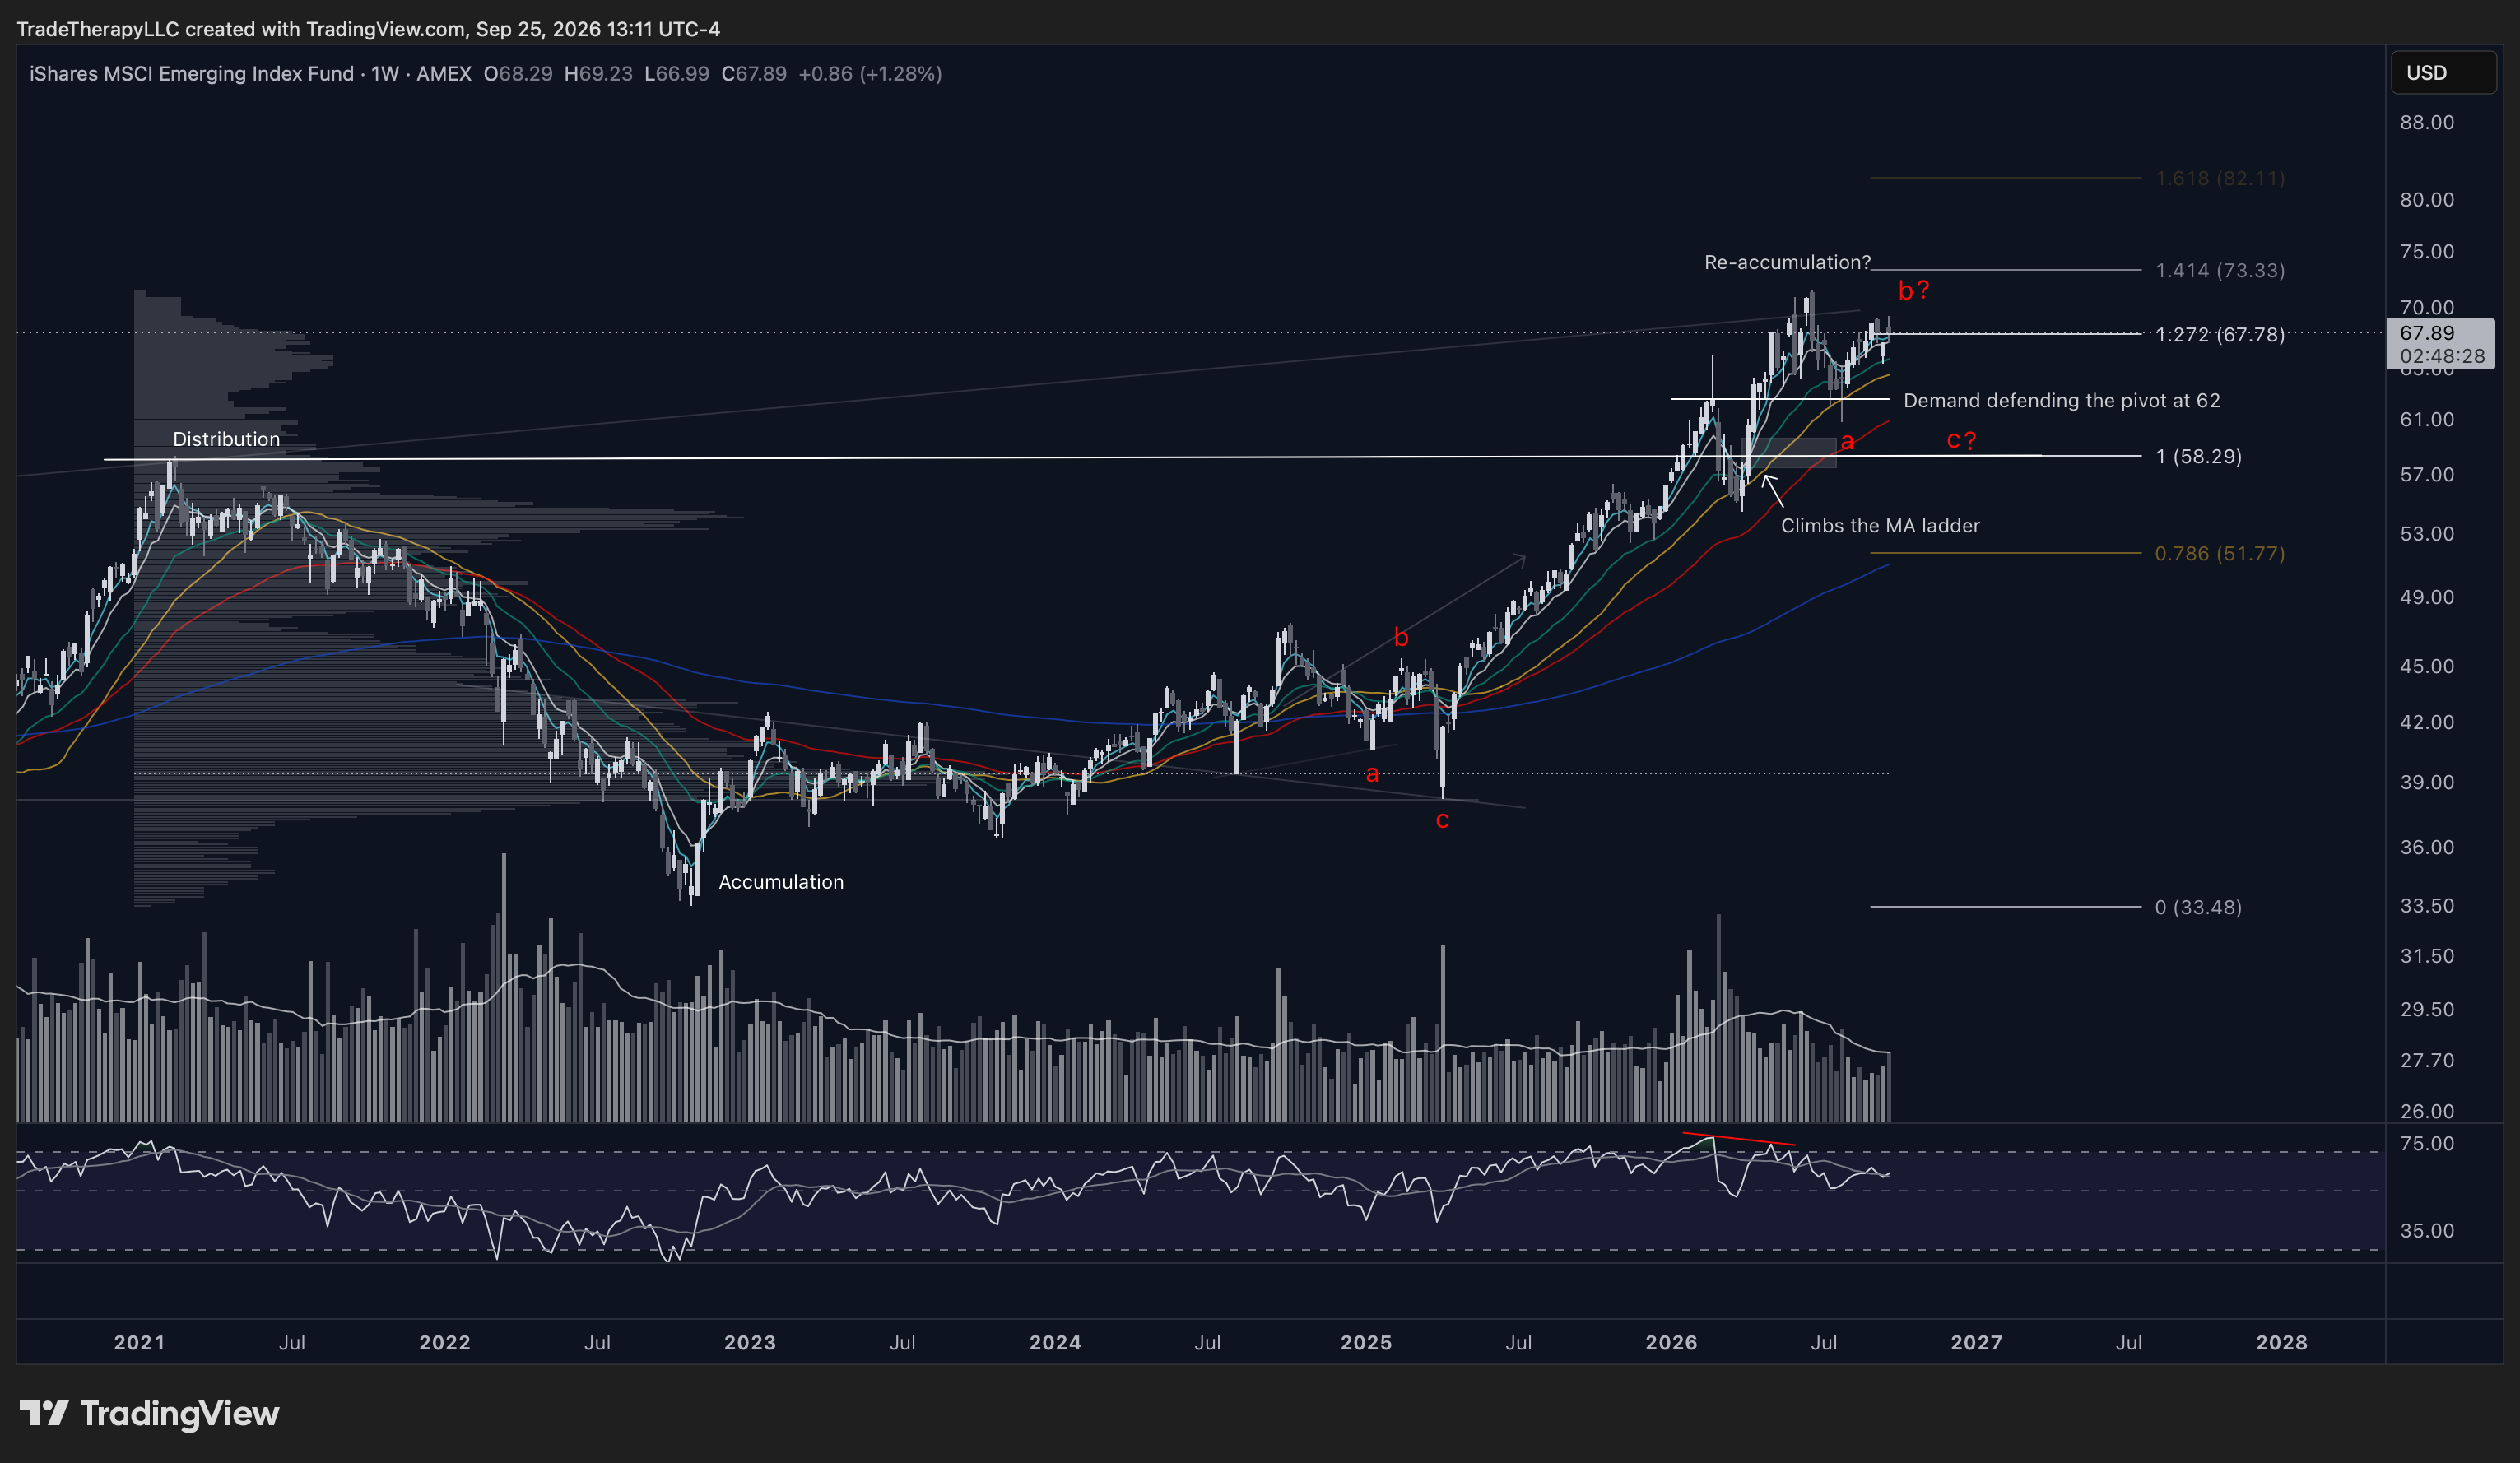
Broad emerging markets are still showing sponsorship near the upper end of the campaign while the China-specific layer works through a much deeper repair. EEM closes the week at 67.89, almost directly on the 1.272 extension at 67.78, after clearing the prior 2021 Distribution high at 58.29 and promoting the chart’s 62 area into a defended demand pivot.
That 62 reference gives the current pause room to develop without immediately damaging the larger advance. The chart already shows demand defending the area, while price has worked back toward the highs and maintained the broader sequence above the rising moving-average structure. The open question is now occurring at the opposite end of the campaign. The red RSI line marks a completed bearish divergence across the 2026 highs, volume has declined from its 2026 peak, and the annotations leave both a possible b? followed by c? and a possible re-accumulation unresolved.
If the current pause develops into re-accumulation, the next visible extension references are 73.33 and 82.11. If b? develops into a larger c?, the chart has already identified 62 as the area where demand would be tested again. The market can therefore correct from elevated levels while preserving the broader advance, provided the promoted structure continues to attract demand.
That separation from China is useful. EEM has reached new highs while FXI and several China-specific names have spent months backtesting much lower portions of their campaigns. The weakness is concentrated rather than broad across emerging markets. If demand begins improving inside China, it will be doing so with a broader EM layer that has remained comparatively strong.
The dollar adds context without resolving the question. DXY closed the week at 101.056 and remains in the chart’s labeled b bounce after the larger decline. Price is sitting beneath the 0.236 reference at 102.375, while the proposed c? leg lower remains conditional. A renewed decline would remove a familiar headwind for emerging markets, but EEM has not required that outcome to maintain its own strength.
- •EEM remains near new highs at 67.89, almost directly on the 1.272 extension at 67.78, after clearing the prior 2021 high at 58.29.
- •The 62 pivot is labeled as defended demand, giving the current pause room to develop without immediately damaging the larger campaign.
- •The red RSI line marks a completed bearish divergence, while declining volume leaves the b?/c? versus re-accumulation question open.
- •Broad emerging markets remain materially stronger than the China layer, so the current weakness in FXI, JD, and BABA is occurring inside a comparatively supportive EM backdrop.
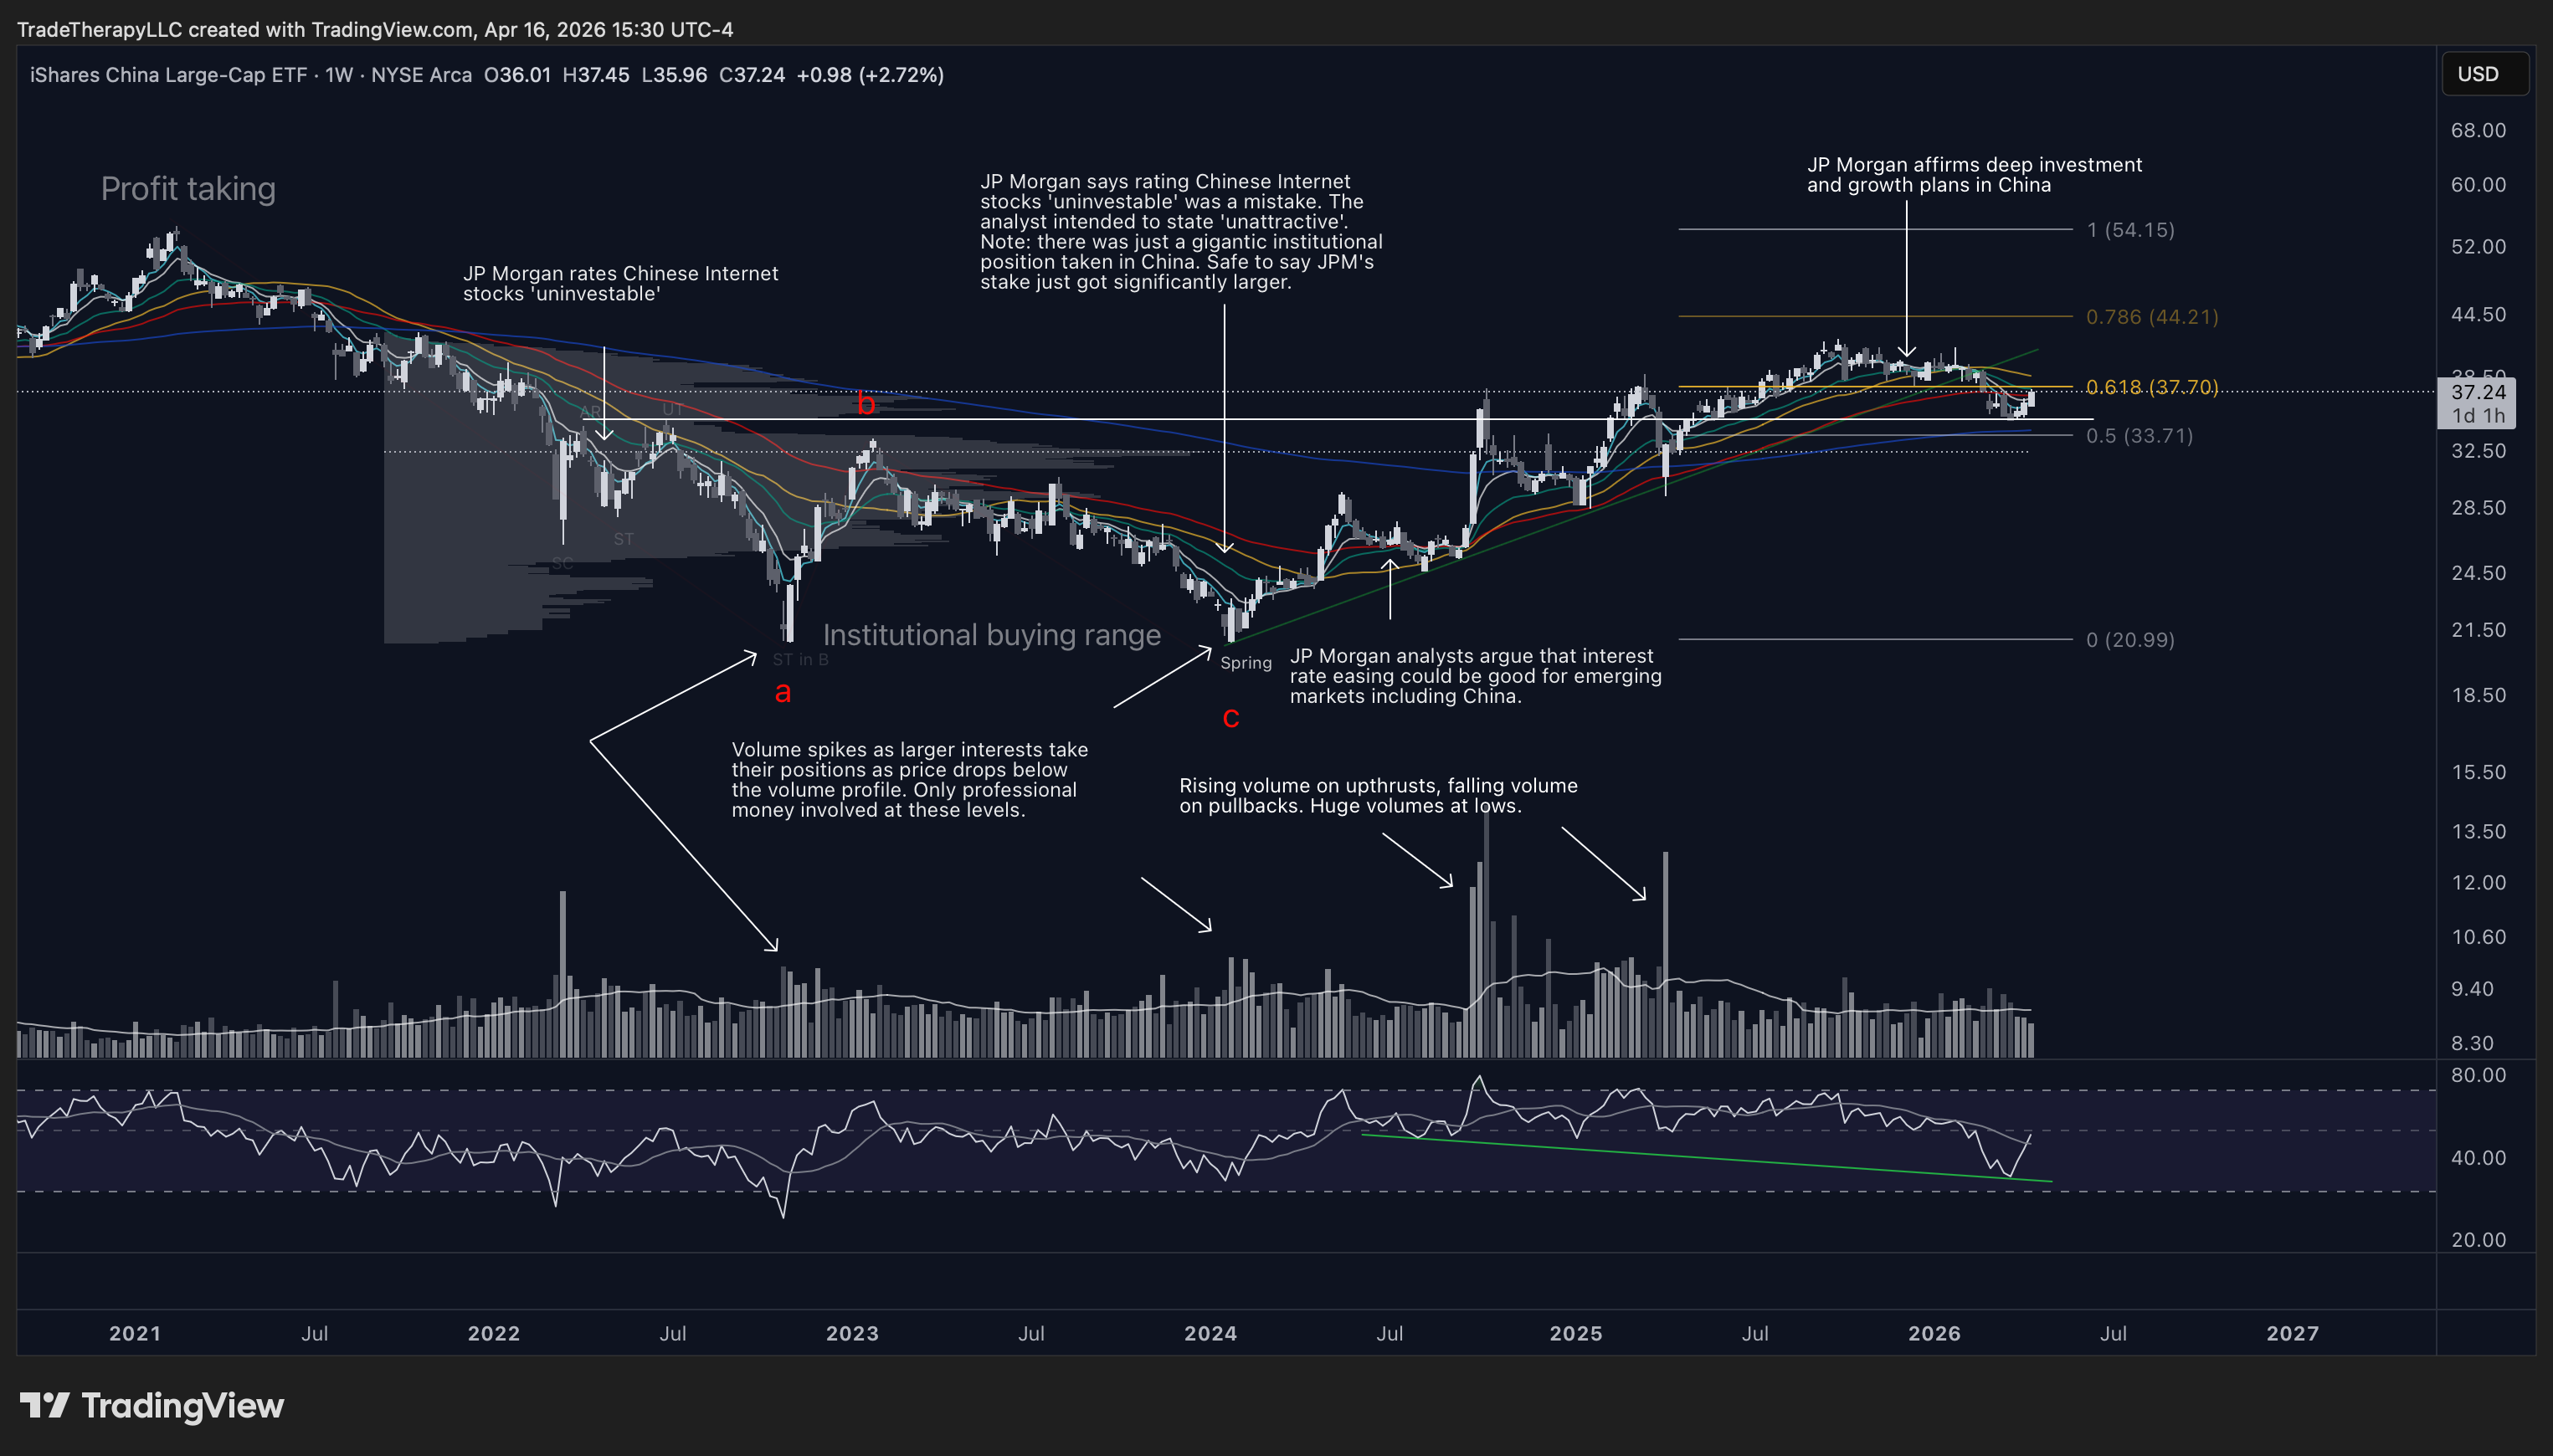
The April chart captured FXI at a genuine decision point. The larger accumulation range had already formed, the spring shown on the chart had resolved into an advance, and the subsequent correction left two viable interpretations: either the pullback was complete and price could resume higher, or the rebound would become the B leg of a larger A-B-C sequence. That was the question the market still had to answer, and the chart gave us a framework for recognizing the resolution without requiring the path to be predicted in advance.
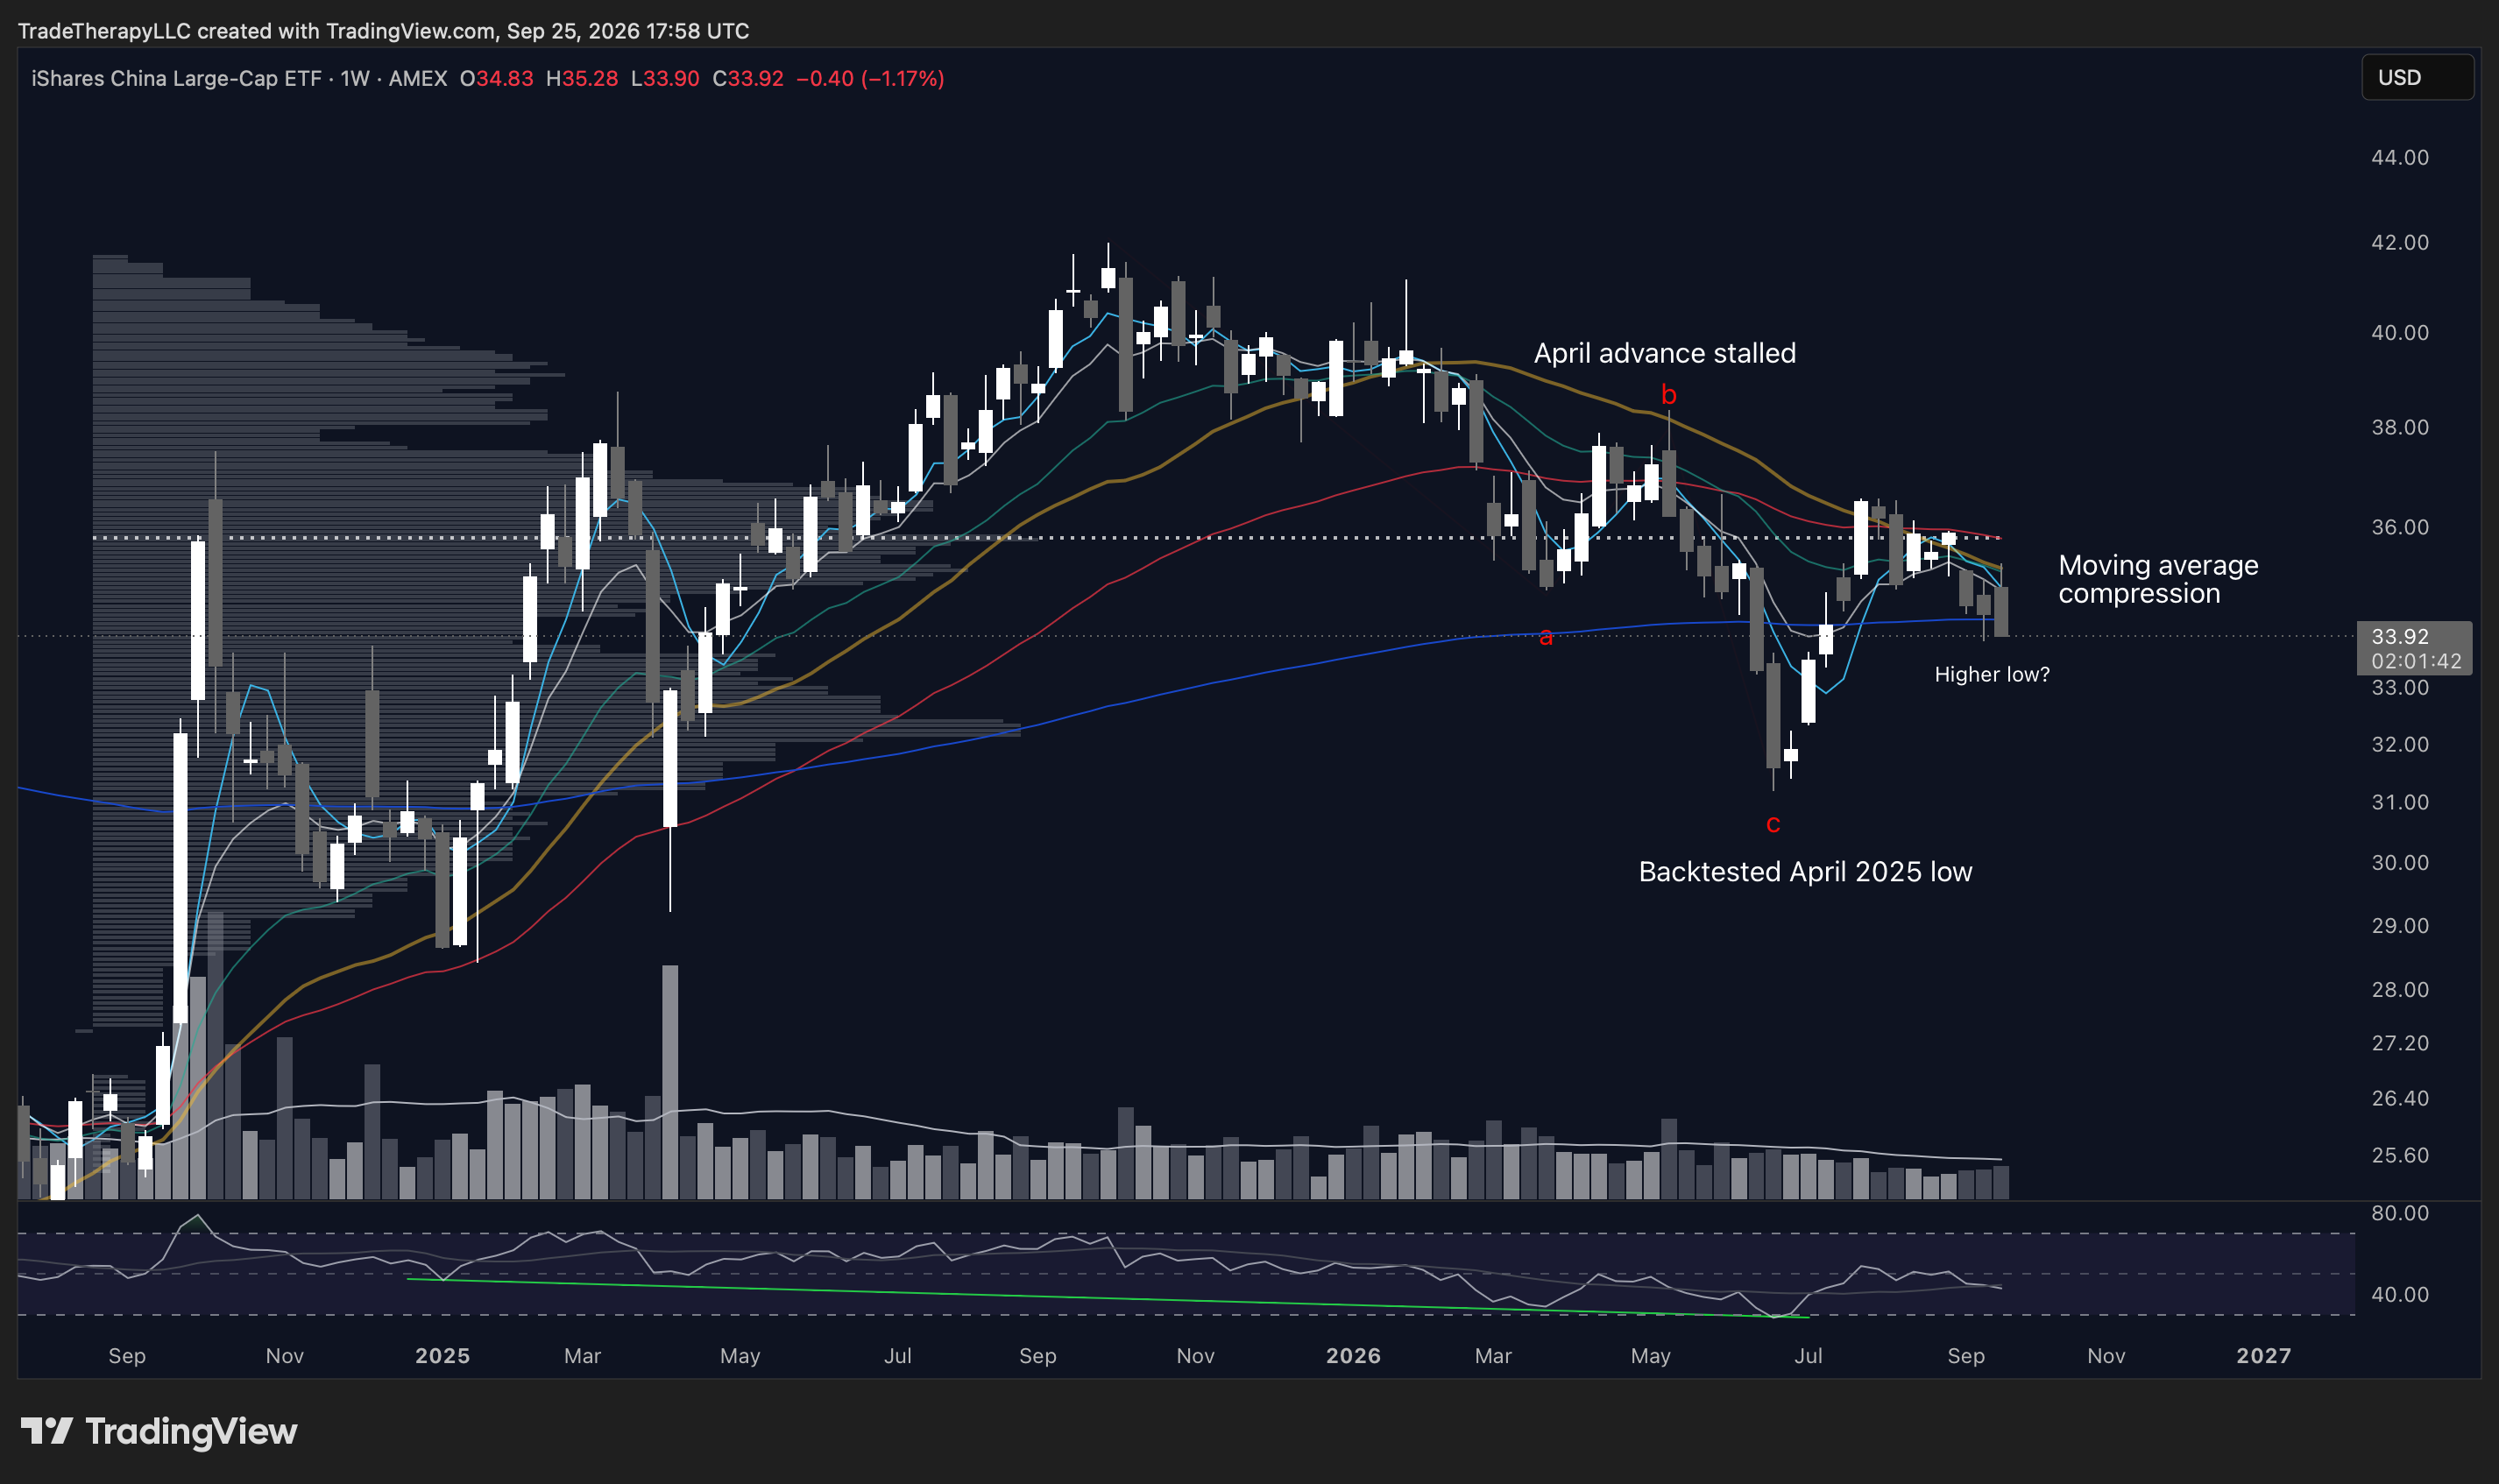
Selling pressure diminished as FXI completed the deeper path. Volume contracted through the c leg into the June low instead of expanding, and the green RSI line marks a completed bullish divergence as price backtested the April 2025 low. The decline traveled farther, but the effort behind it was fading as the test matured.
FXI now closes at 33.92 after rebounding from that June low and then slipping back toward the 200-week EMA. The faster weekly averages remain compressed overhead, leaving the chart’s “Higher low?” annotation appropriately unresolved. Demand has an opportunity to establish a higher low above the June c low, but that has to occur while price is still working beneath a compressed trend stack that has not yet been reclaimed.
The sequence since April is now much clearer. The advance into b stalled, the c leg carried price back to the prior low, and selling participation contracted during the descent. Price kept falling, but supply produced progressively less result as the correction approached its endpoint.
Xi Jinping’s state visit closed without major breakthroughs beyond extending the trade truce into 2027, and FXI still finished the week lower. The political backdrop is context rather than technical evidence. It provided a high-attention liquidity window while price remained engaged with the same structural test already visible on the chart.
Major policy events concentrate attention and participation, giving larger investors more liquidity to adjust exposure. The headline alone does not reveal whether that activity is accumulation or distribution. That information comes from what price can retain after the event.
The summit week did not produce a reclaim of the compressed moving-average cluster or confirm the proposed higher low. Those are the next pieces of evidence the tape still owes.
- •The April fork resolved through the B-then-C route, with the c leg backtesting the April 2025 low in June.
- •Volume contracted through the c leg, and the green RSI line marks a completed bullish divergence into the June low.
- •FXI is testing whether it can establish a higher low while sitting near the 200-week EMA and beneath compressed faster averages.
- •The China layer remains weaker than EEM, so improvement now depends on price promoting the June low into durable demand rather than on the headline environment.
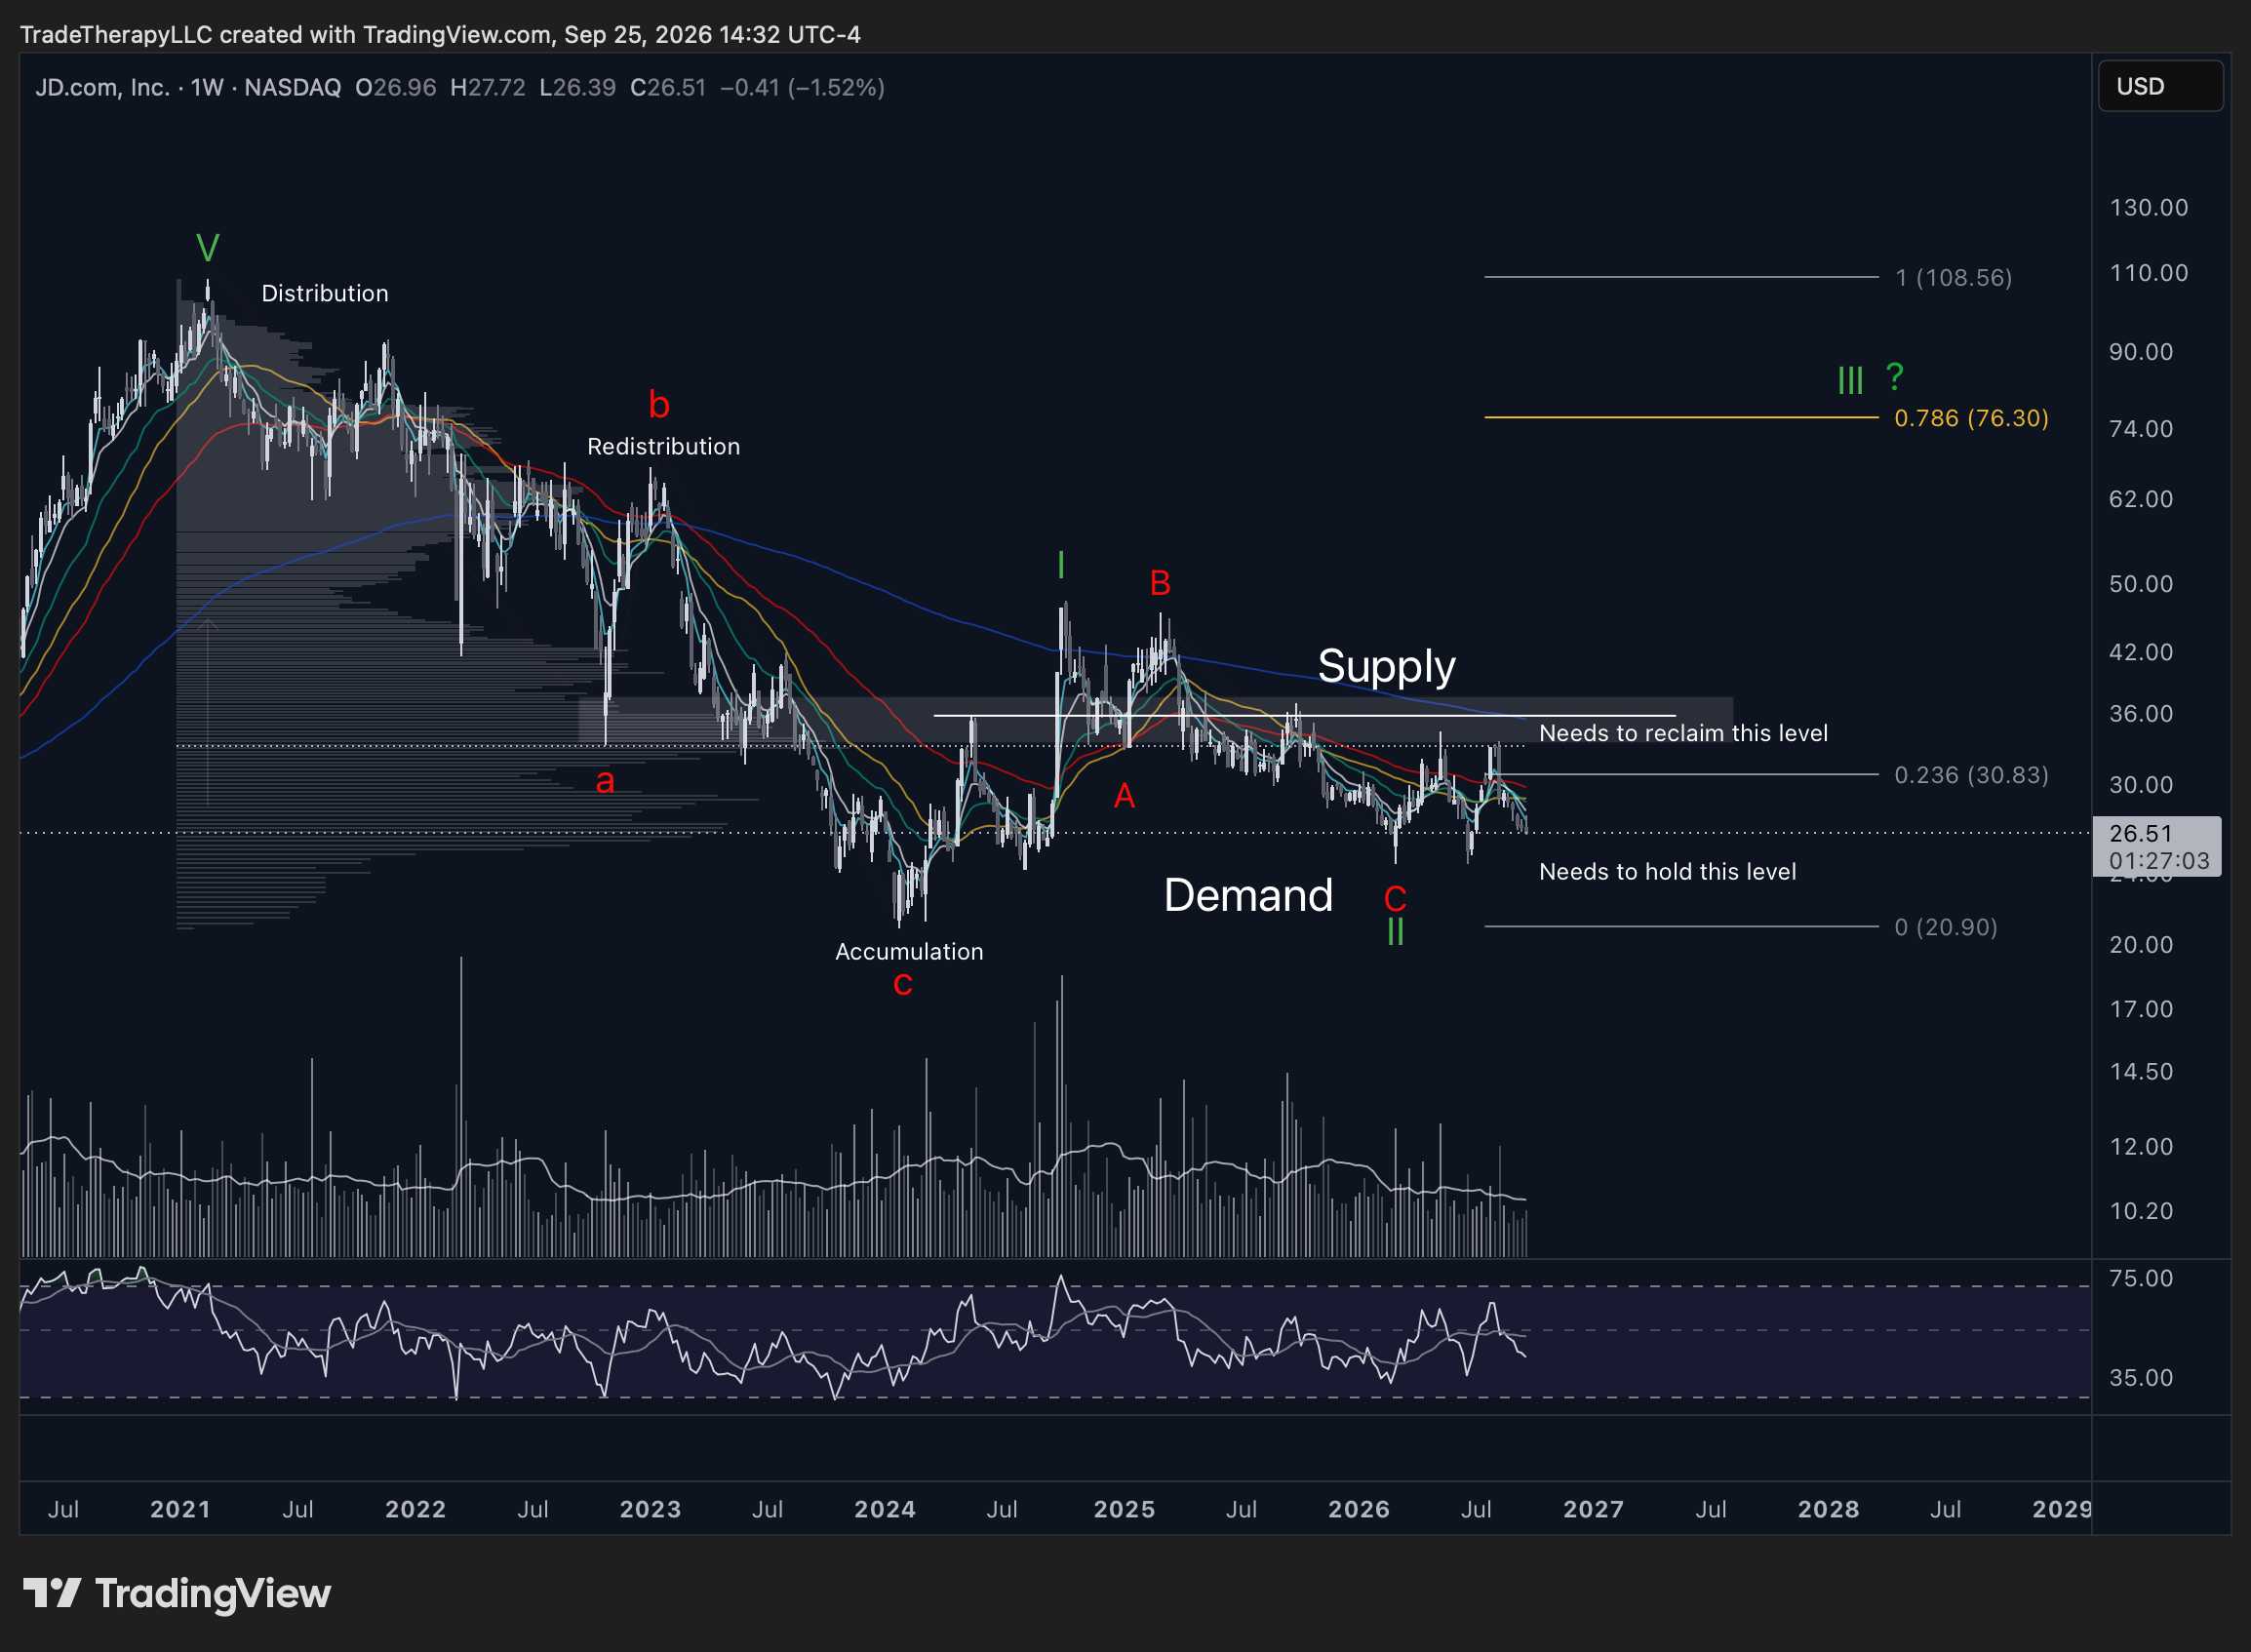
JD is showing the weaker expression of the same broad campaign anatomy developing in BABA. The chart carries a completed Wave I followed by a three-wave correction into the 2026 low, but price has not yet repaired enough of the weekly structure to confirm that the next expansion leg is underway.
JD closes the week at 26.51, still beneath the 0.236 retracement at 30.83 and below the larger supply zone around 36. The chart explicitly marks that supply as an area price “Needs to reclaim,” while the current mid-20s region is identified as demand that “Needs to hold.” That leaves the stock between a defensive obligation and an offensive one.
The first job is to preserve the current demand area and prevent another deterioration in the corrective structure. The second is to reclaim 30.83 and then work back through the supply zone. Until those steps begin occurring in sequence, JD remains pinned beneath overhead supply rather than demonstrating that demand has regained control of the weekly trend.
The moving-average structure reinforces that condition. Price remains beneath a declining cluster instead of using those averages as support, which keeps overhead friction active on rebounds. Demand has stopped the prior decline, but it has not yet promoted the current floor into a broader trend change.
The question-marked III at 76.30 belongs to the longer-range map and remains conditional. The nearer work comes first: hold demand, reclaim 30.83, and begin repairing the supply zone around 36. Progress through those references would change the character of the chart. Until then, the larger count remains a framework rather than confirmation.
- •JD shows a completed Wave I followed by a three-wave correction into the 2026 low, but the repair remains less advanced than BABA’s.
- •Price at 26.51 is still beneath the 0.236 retracement at 30.83 and below the supply zone around 36 that the chart says must be reclaimed.
- •The immediate test is whether the current demand area in the mid-20s continues to hold while price works against the declining weekly trend stack.
- •The question-marked III at 76.30 remains a conditional long-range label; the current campaign first needs to reclaim nearby supply and promote a higher floor.
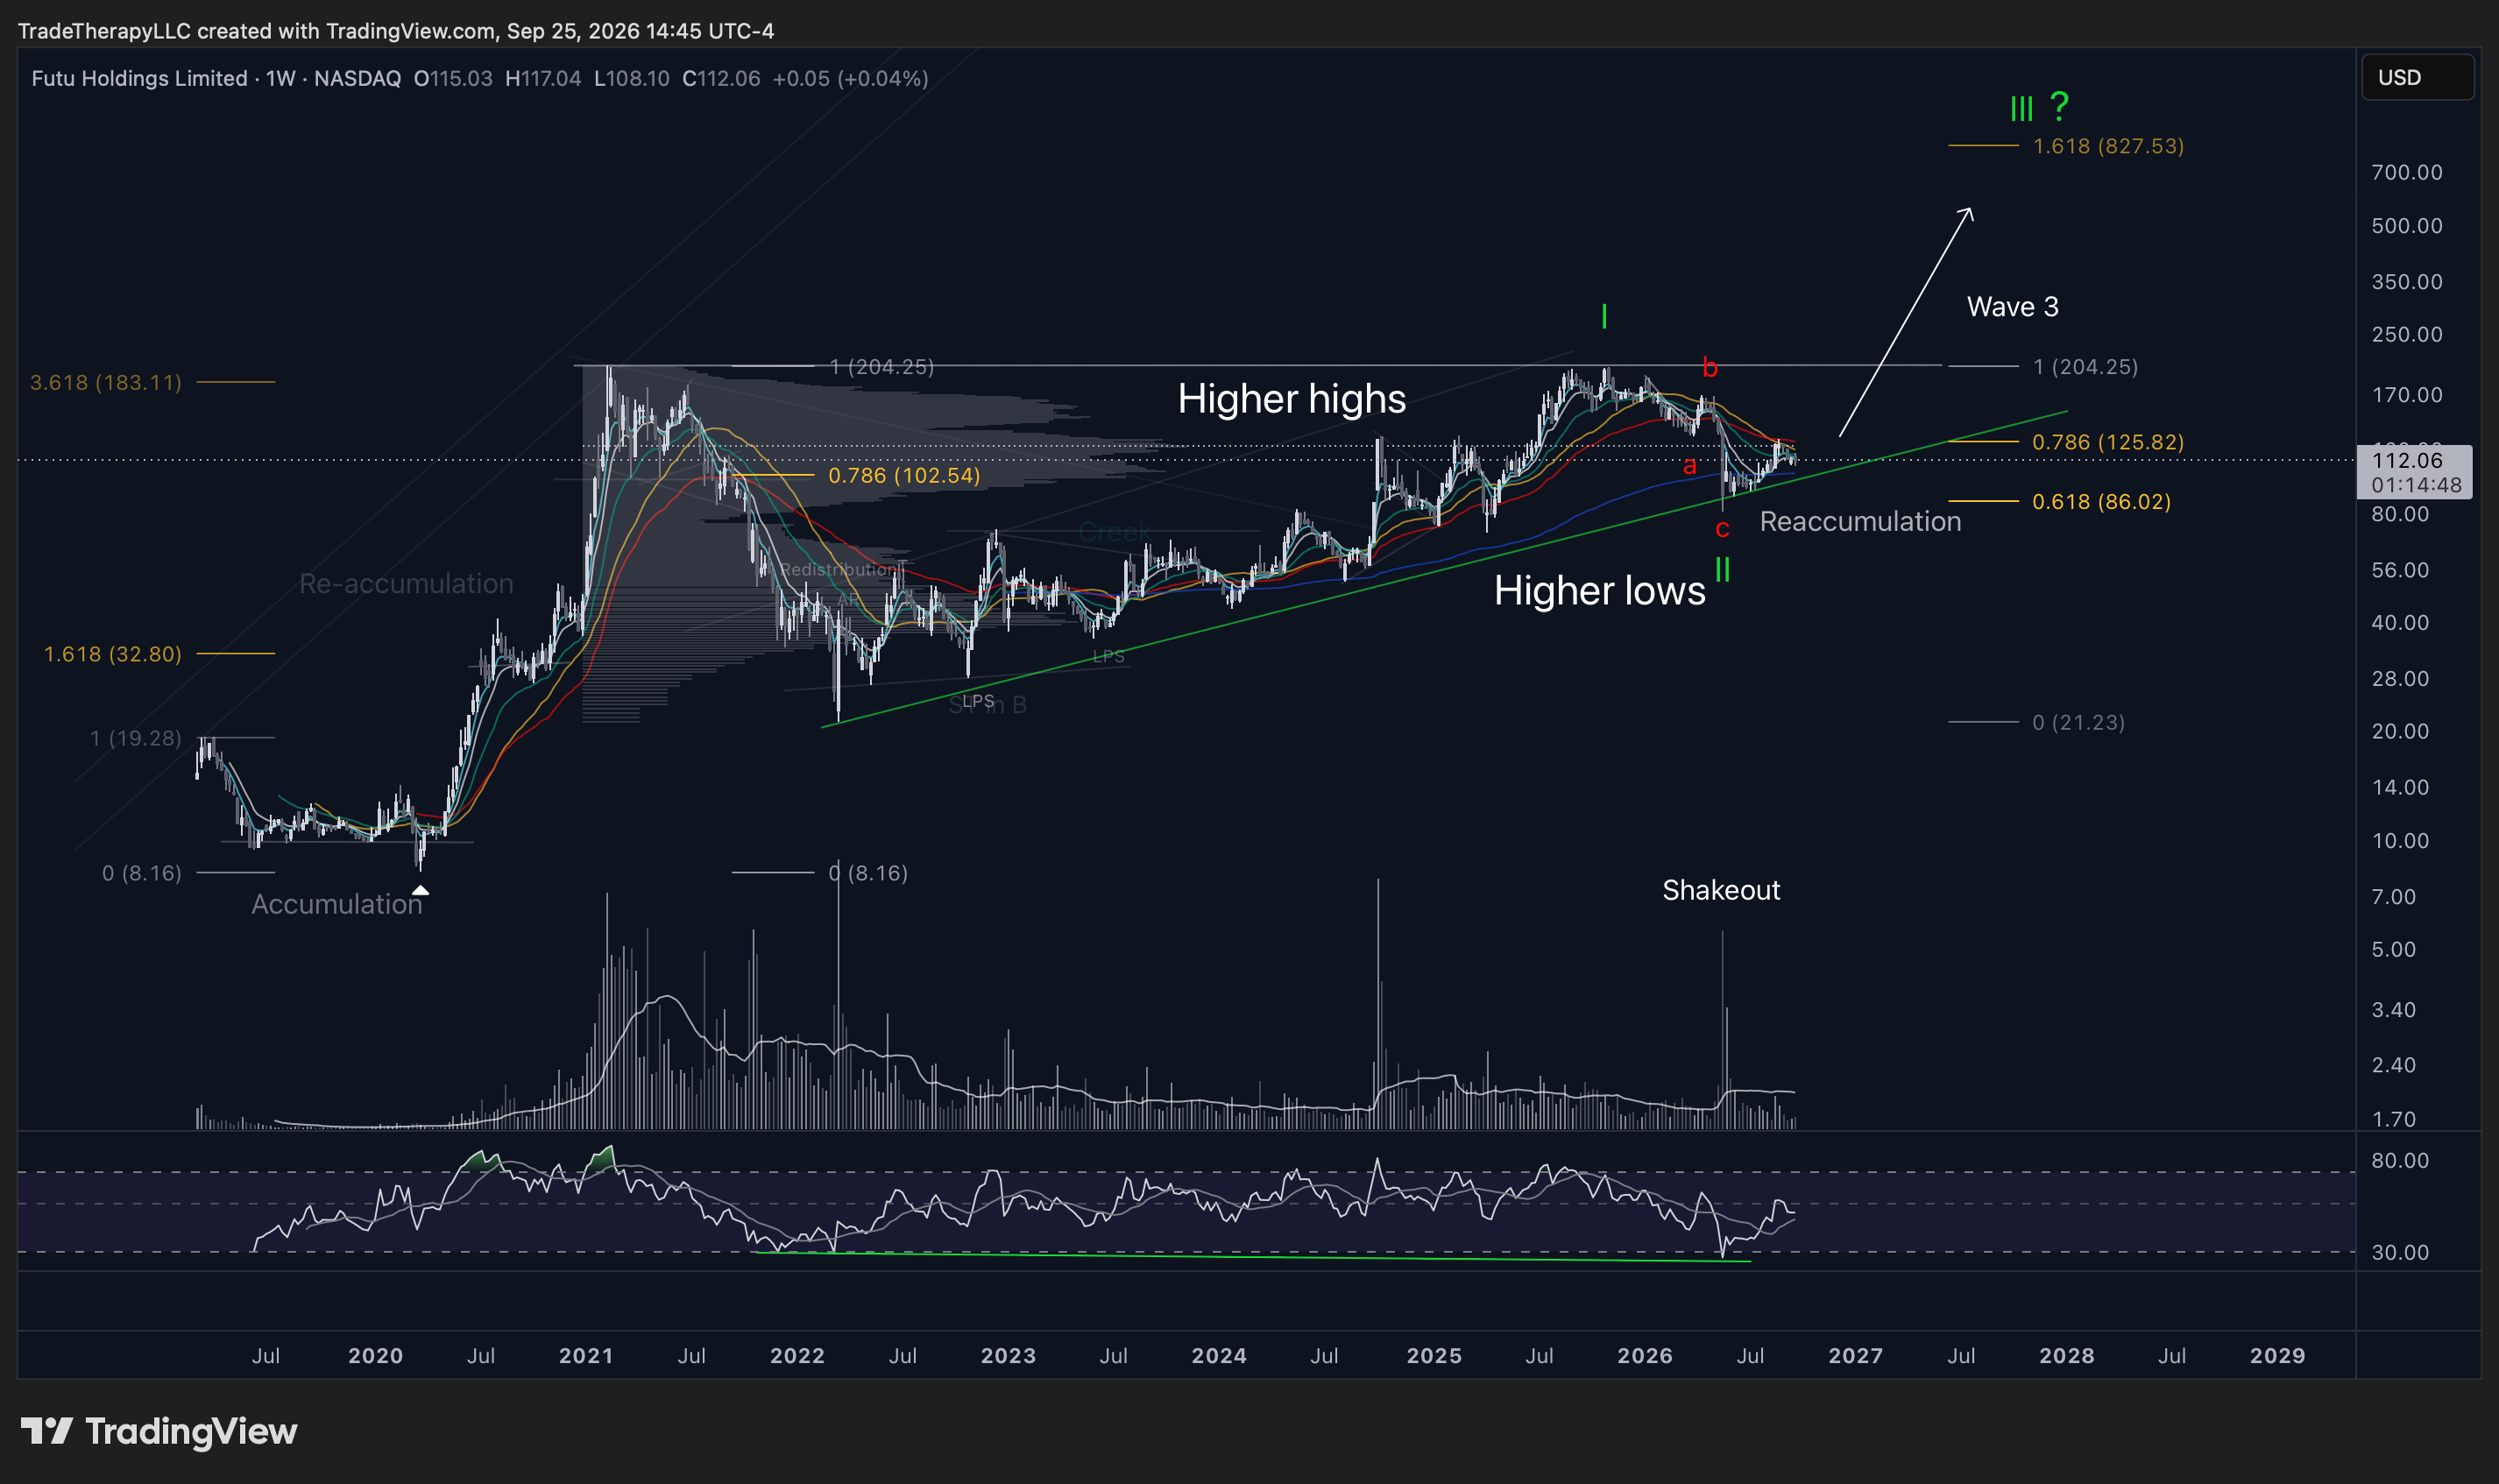
FUTU gives us the strongest example in the China group of demand answering a deep correction with force. Its 2025 Wave I advance ended near 204 before the chart worked through a three-wave a-b-c decline into Wave II. The c leg reached the 0.618 retracement at 86.02 and produced the chart’s labeled Shakeout alongside a sharp volume spike. Price did not stop falling quietly. The final leg forced a burst of participation into the low before reversing away from it.
That reset preserved the rising demand line that has organized the larger sequence of higher lows. FUTU now closes at 112.06, well above the Wave II area and back above the legacy 0.786 reference at 102.54. Vol. 108 had FUTU at 99.37 with 102.54 still needing to be reclaimed, and that work has now been completed.
The next test is different. FUTU is trading beneath 125.82, the 0.786 retracement on the forward grid from the 2022 low at 21.23 to the 2025 high at 204.25, while the descending moving-average cluster remains overhead. The 102.54 and 125.82 references come from separate Fibonacci measurements, so each describes a different piece of the repair. Reclaiming the legacy level showed that demand could recover lost ground. Clearing 125.82 would mark further progress through the forward grid while also carrying price deeper into the overhead trend structure.
The price behavior between those references is constructive but unfinished. The chart continues to show higher highs and higher lows above its rising demand line, while the green RSI line marks a completed bullish divergence extending from 2022 into the 2026 low. At the same time, the overhead average cluster has not been fully converted into support. That keeps FUTU in re-accumulation work rather than giving the next impulsive phase a completed confirmation.
The forward Wave 3 arrow and III? at 827.53 belong to the long-range map. They describe what the larger count could support if the campaign continues to build through successive degrees. They are not near-term objectives. The actionable evidence remains much closer to price: 102.54 has been reclaimed, 125.82 remains overhead, and the current repair has to keep promoting higher floors beneath that next reference.
- •FUTU completed its a-b-c Wave II correction at the 0.618 retracement at 86.02, where the chart marks a Shakeout accompanied by a volume spike.
- •The legacy 0.786 at 102.54 has now been reclaimed after remaining unresolved in Vol. 108.
- •Price at 112.06 is working beneath 125.82 on the forward grid from 21.23 to 204.25 and beneath a descending moving-average cluster that still needs repair.
- •The III? at 827.53 is a conditional long-range label; current confirmation depends on holding the repair and continuing to promote higher floors through nearby resistance.
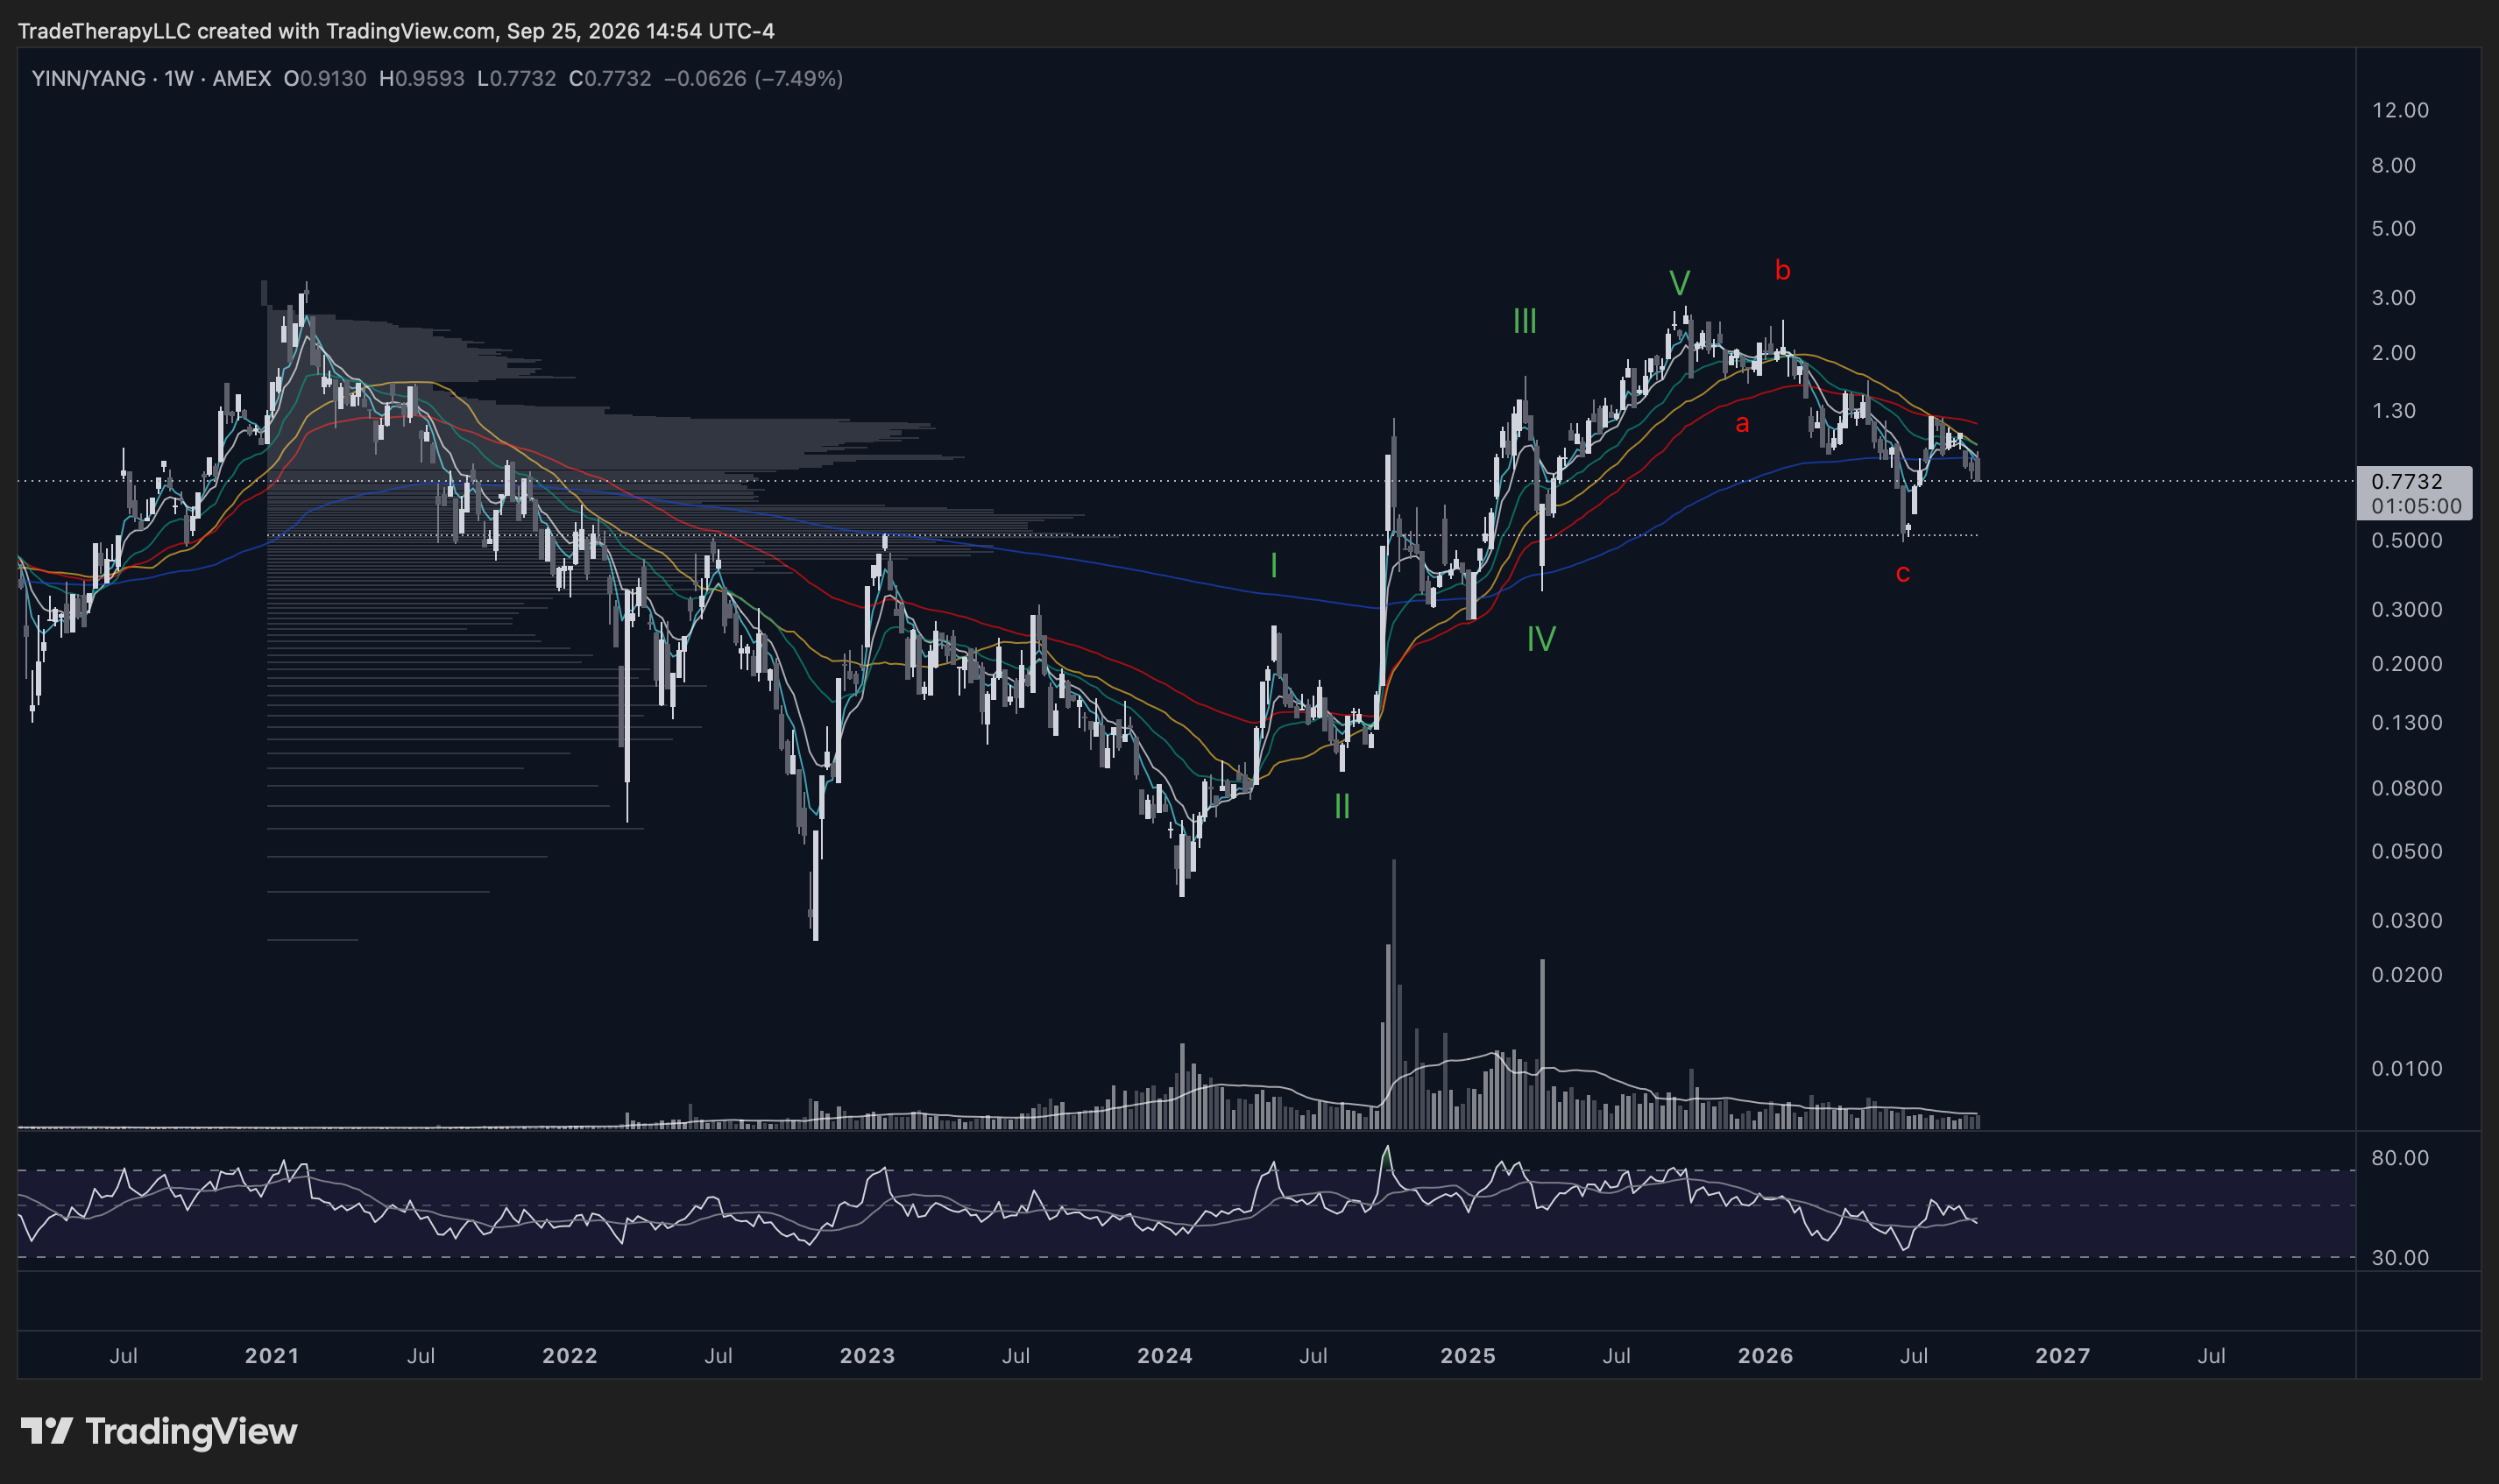
The leveraged participation ratio completed a full five-wave advance from 2024 into the 2025 high before correcting through the chart’s labeled a-b-c sequence. That corrective path reached c near the dotted 0.50 area in June 2026, completing the three-wave decline after the earlier impulsive advance.
The recovery since June has been less decisive than the completed count might suggest. YINN/YANG finishes the week at 0.7732 after slipping back beneath the 200-week EMA, while the faster averages remain overhead. The ratio has responded from the c low, but it has not yet regained the trend layers that would demonstrate sustained higher-beta participation across the China trade.
Volume provides another useful restraint. The volume average has been contracting since the 2025 peak, including through the corrective phase and the subsequent recovery attempt. That does not negate the completed a-b-c structure. It means participation has not expanded enough to establish that the correction has transitioned into a durable new advance.
This ratio is useful because leveraged products tend to magnify shifts in appetite. When higher-beta participation begins reclaiming and holding its trend layers, it can confirm that investors are moving farther out on the risk curve. When the ratio remains beneath those layers, the underlying China complex may still be repairing even if individual names begin showing stronger setups.
For BABA, that keeps the top-down signal mixed in a useful way. The corrective anatomy in leveraged participation has finished, yet the ratio has not confirmed a turn through trend reclamation. BABA therefore does not need the proxy to lead, but a recovery back through those layers would strengthen the evidence that its own repair is occurring inside a widening China rotation rather than in isolation.
- •The ratio completed a five-wave advance into the 2025 high followed by an a-b-c correction into the June 2026 c low near 0.50.
- •YINN/YANG ends the week at 0.7732 and has slipped back beneath the 200-week EMA, leaving trend reclamation incomplete.
- •The volume average has contracted since the 2025 peak, so the rebound has not yet produced a broad expansion in leveraged participation.
- •The completed correction improves the setup, but confirmation still requires the ratio to recover and hold its trend layers as China risk appetite rebuilds.
Top-Down Summary
Substantial corrective work, uneven confirmation.
The evidence across the complex is no longer moving in one uniform direction. EEM sits near new highs with its 62 pivot defended, showing that global emerging-market demand has remained intact even while China has undergone a deeper reset. That gives the group a supportive outer layer, but it does not resolve the work still occurring inside China itself.
FXI completed the B-then-C path that remained open in April. The c leg backtested the April 2025 low as volume contracted and the marked bullish RSI divergence completed. That gives the decline a recognizable exhaustion profile, yet price remains near the 200-week EMA and beneath compressed faster averages. The next evidence has to come through a higher low and trend reclamation.
The individual names show how uneven that repair can be. JD completed Wave I and a three-wave correction, but it remains pinned beneath 30.83 and the supply zone around 36. FUTU is further along. Its Wave II ended with a climactic Shakeout at 86.02, price reclaimed the legacy 102.54 reference, and the stock is now working beneath 125.82 and its descending average cluster. One is still trying to get out from under supply. The other has already recovered an important reference and is testing whether that repair can be extended.
YINN/YANG sits between those messages. Its five-wave advance and three-wave correction are complete, but the ratio has slipped back below the 200-week EMA and has not regained the trend layers needed to confirm stronger leveraged participation. That makes the participation evidence constructive in anatomy and incomplete in execution.
Taken together, the top-down read says the China correction has done substantial work without yet producing broad confirmation of the next expansion phase. EEM provides the strongest external sponsorship. FXI has completed the deeper backtest. FUTU demonstrates what stronger repair looks like. JD and YINN/YANG show where confirmation is still missing. BABA now has to be judged against that mixed but improving backdrop.
What This Means To You
A completed correction is not a completed repair.
A completed correction and a completed repair are two different stages of the process. Several charts in the China complex have already finished recognizable corrective structures. That identifies where the prior selling sequence may have exhausted, while the next phase still has to show that demand can rebuild and retain the trend.
The next phase is about promotion. FXI needs to turn the June low into a higher low and work back through its compressed averages. JD needs to preserve demand and reclaim nearby supply. FUTU has already recovered 102.54, but it still has 125.82 and the descending trend cluster overhead. YINN/YANG has completed its corrective count while remaining beneath the 200-week EMA. Each chart is asking the same broader question from a different position: can recovered ground become durable support?
When a market comes out of a deep backtest, the first rebound can be sharp because selling pressure has already been exhausted. The more durable evidence arrives afterward, when price is asked to hold during the next pullback. If those pullbacks travel less distance, attract less supply, and stop above the prior corrective lows, demand is beginning to promote the structure rather than simply react to an oversold condition.
The broad backdrop gives that process room to work. EEM is already operating near new highs, so China is not trying to rebuild while the entire emerging-market complex is breaking down around it. At the same time, the gap between EEM and the China-specific charts prevents us from treating broad EM strength as confirmation that China’s repair is finished.
For BABA, the standard is therefore straightforward. A deep correction can remain part of an accumulation campaign if the selling sequence exhausts and the market begins promoting higher floors afterward. The next evidence comes from how BABA behaves after its own Wave II reset: whether demand can retain recovered ground, absorb another pullback without reopening the prior low, and begin reclaiming the trend layers that would turn stabilization into renewed expansion.
Featured Analysis · BABA
One campaign, from accumulation into Wave II.
Clarity began following BABA in July 2024, when the all-time chart showed late-stage accumulation after the 2022 low and a multi-year bullish divergence. September 2024 caught the breakout as Chinese stimulus arrived, December read the pullback as a backup to the edge of the creek, and April 2025 identified institutional volume at the low. By July 2025, BABA was still an “ugly chart” sitting in a 102 to 107 buying range just before the final leg of Wave I carried price toward 192. This has been one campaign followed from accumulation through Wave I and into Wave II, which gives the current correction context that a standalone chart would miss.
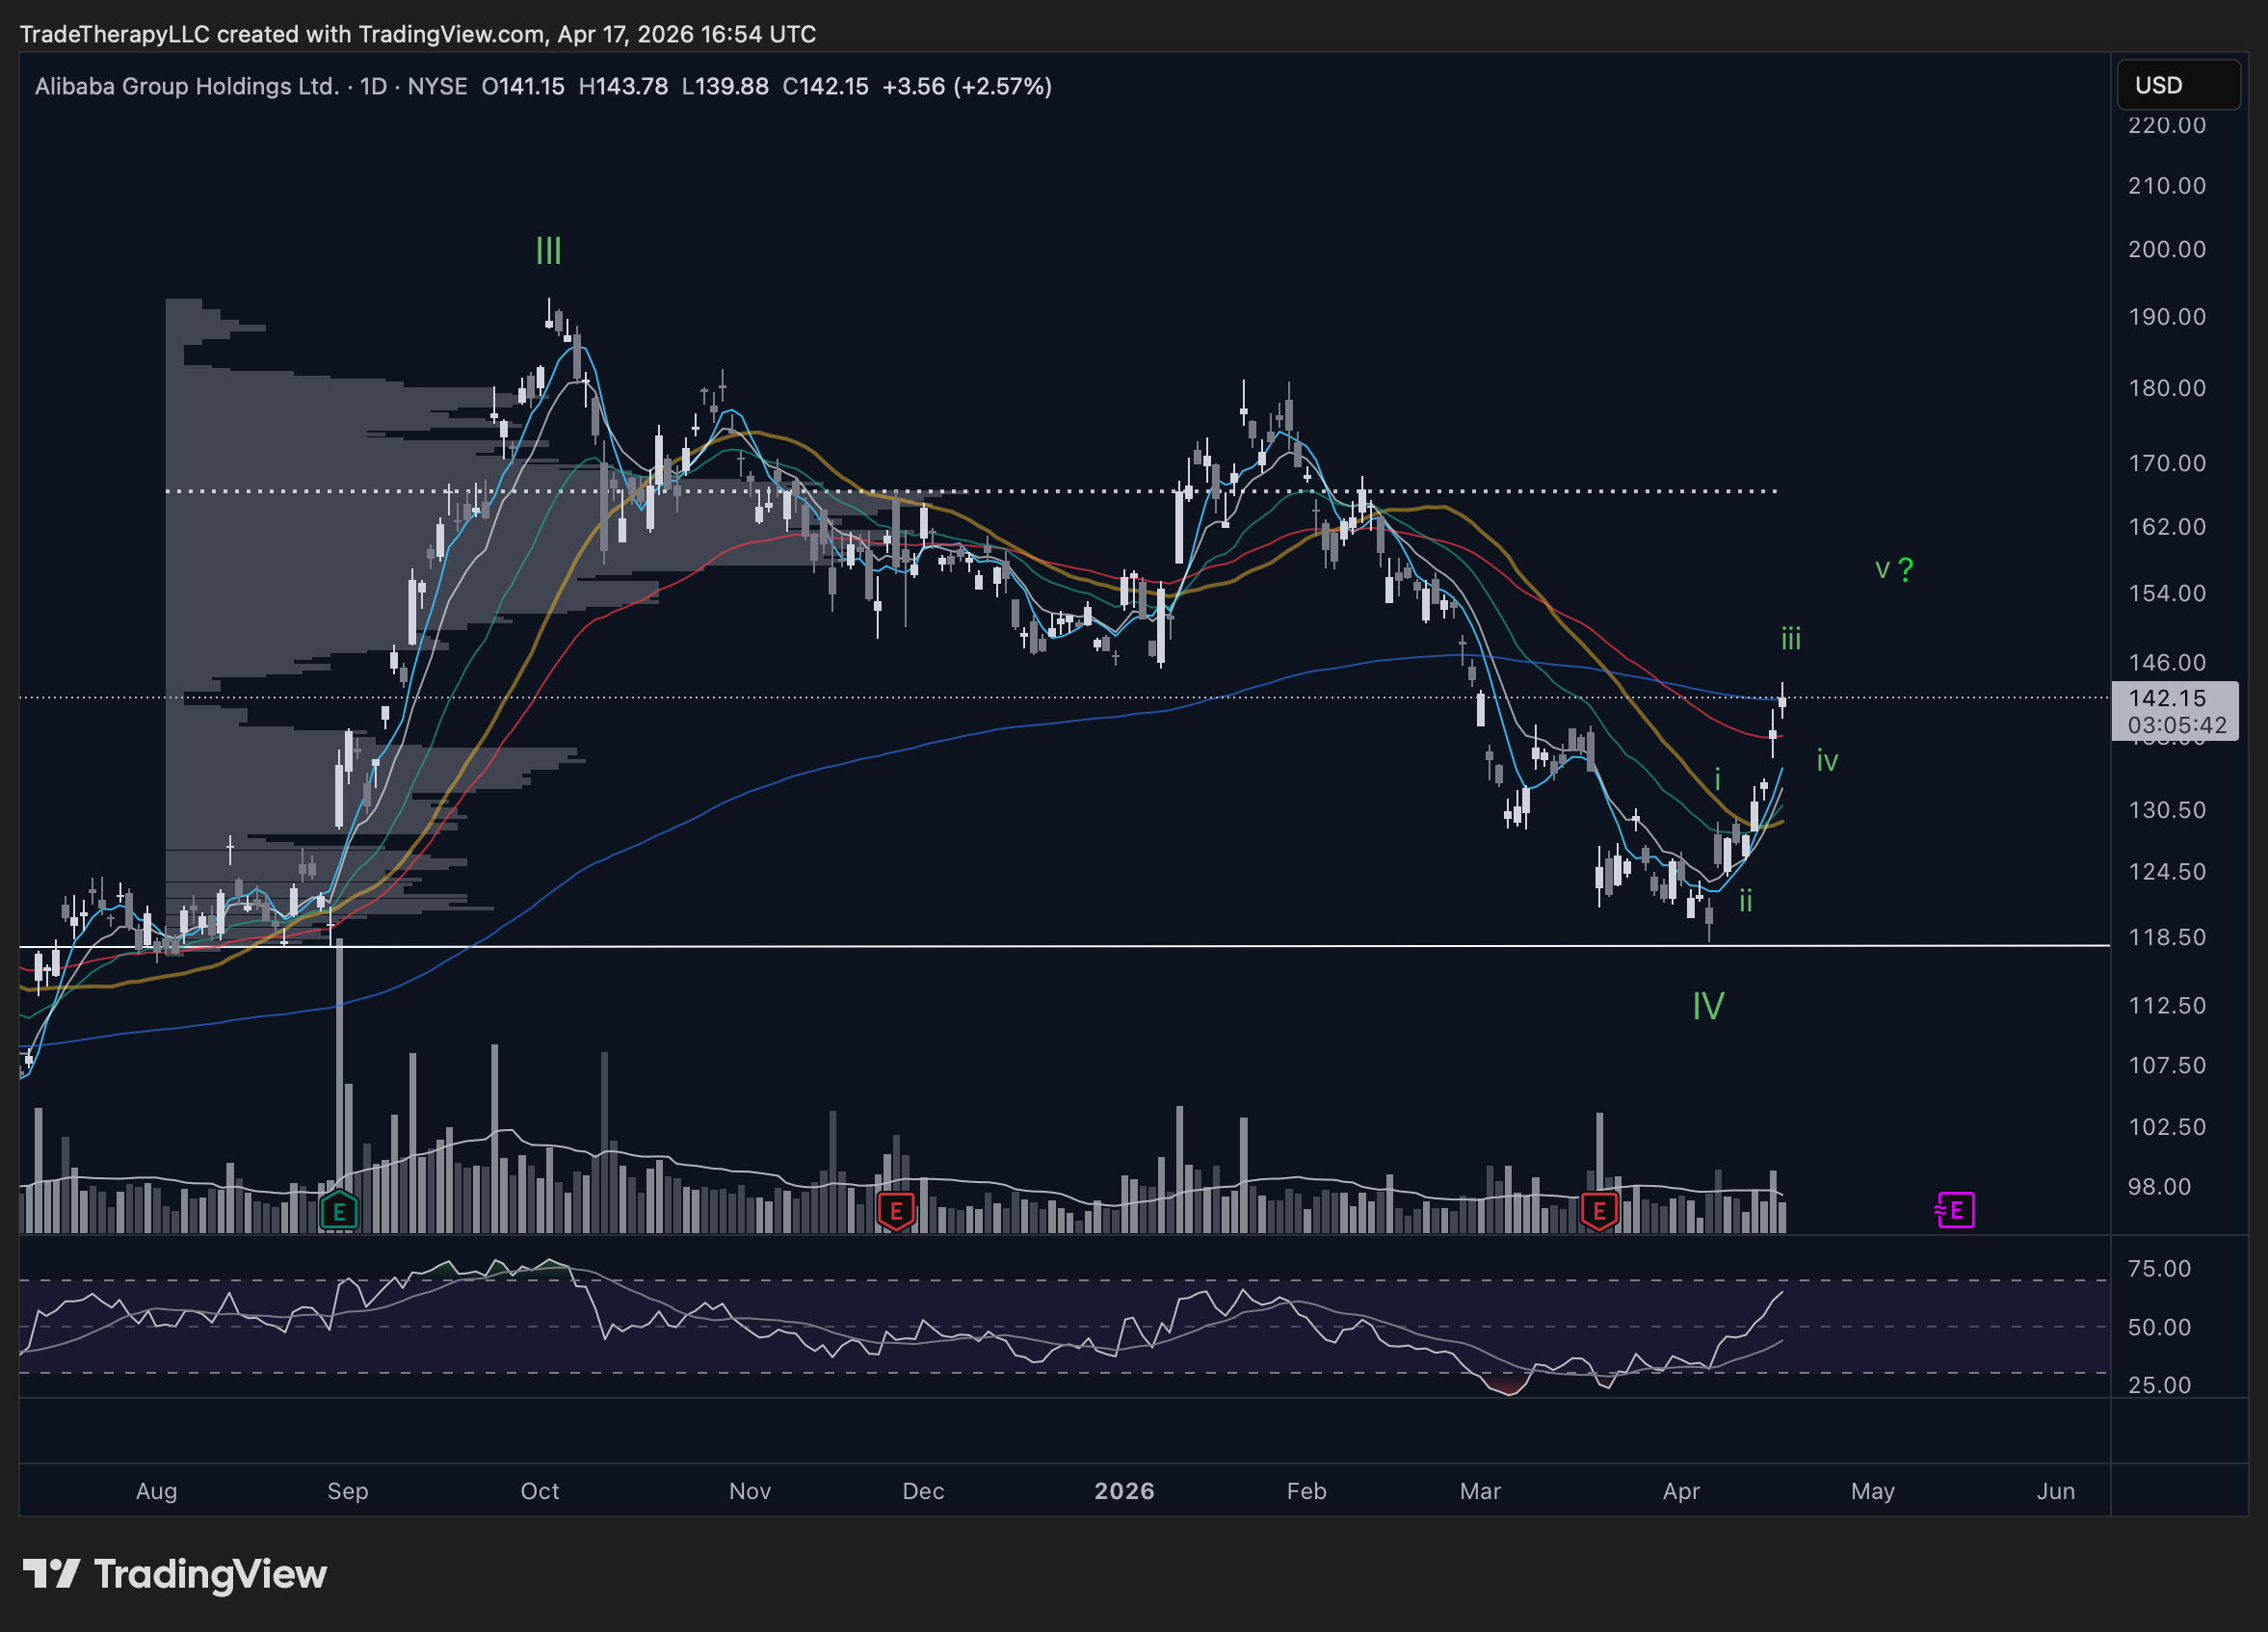
The run toward 192.67 did more than extend the markup. It drew late buyers into an increasingly mature advance, creating a new layer of ownership above the institutional base. Operators do not need every projected subdivision to complete if the campaign has already attracted enough participation. Once that crowd was built, the next correction had a job to do: force those higher-cost holders to give shares back at lower prices before the larger campaign could continue.
The April chart still labeled the October high as Wave III and the April low near 118.50 as Wave IV, but the subsequent decline changed that interpretation. The October 2025 high at 192.67 is now the fifth wave of a completed Wave I, while the April low became A, the May rebound became B, and the June decline to 91.99 completed C/II. Wave I ended sooner than expected and Wave II ran deeper than expected. The count changes once here because the institutional read changed with it: the markup attracted a crowd, and the correction became the mechanism needed to clear that crowd.
The operators who built the 2022 to 2024 base entered the campaign with a cost basis far below current price. That cushion changes what a deep correction means. A holder who accumulated near the bottom of the cycle can tolerate a much larger backtest than someone who bought during the Wave I markup, which allows stronger hands to let price travel lower without threatening the core position.
Wave II therefore functions as an ownership transfer. Shares bought by later participants during the markup are forced back into the market as the correction deepens, while holders with lower entries have room to absorb that supply. The larger Wave 3 can only develop if that handoff does enough work to reduce the overhead created during Wave I.
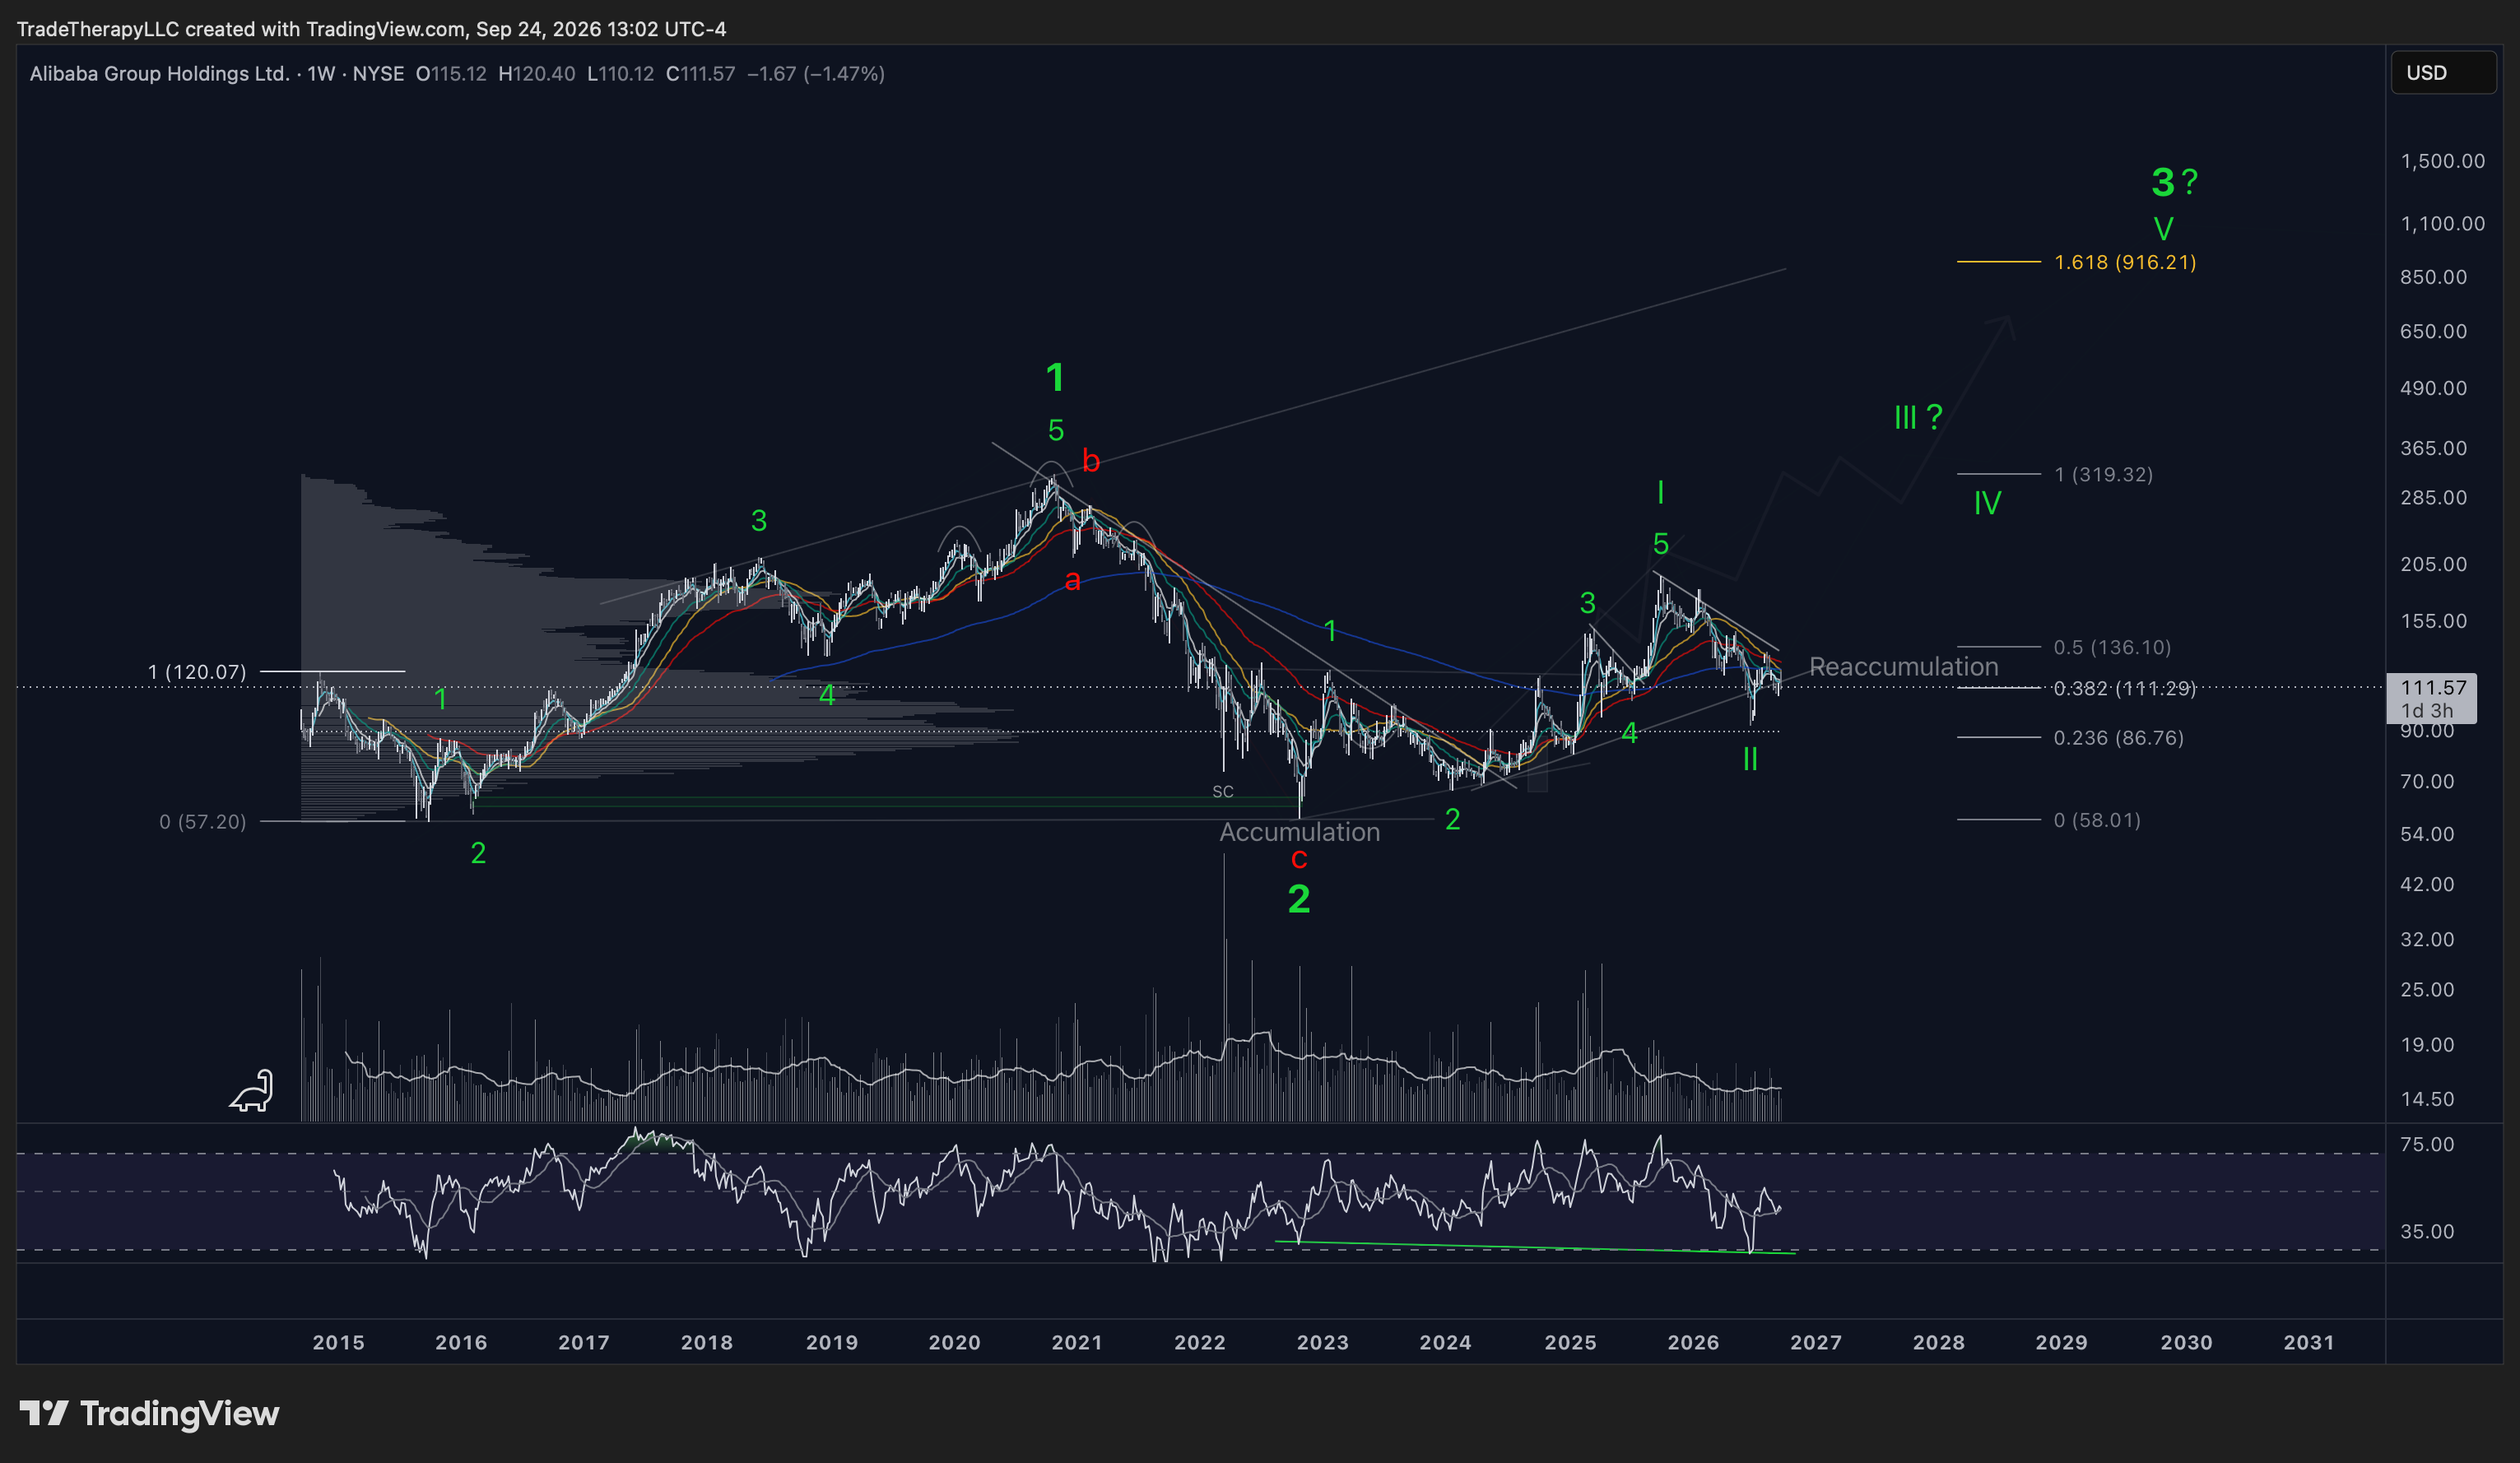
The July 2024 archive established the foundation beneath that campaign. The October 2022 low at 58.01 held $0.81 above the 2015 low at 57.20, preserving the larger three-wave cycle. That relationship still anchors the macro count. Price is now working around the 0.382 reference at 111.29 on the macro grid, well above the base that originally defined the larger structure.
The forward III?, IV, V, and larger 3? labels remain conditional because the shift in ownership still has to prove itself through price behavior. The 1.618 at 916.21 belongs to that long-range structure and is not a near-term target. The immediate question is whether enough of the shares bought during Wave I have changed hands for demand to begin promoting higher levels again.
Headlines usually arrive after positioning has already started. Institutions build exposure while the story is still uncomfortable, then public developments provide the liquidity and narrative needed for a broader market to participate. By the time a deal, policy shift, or major announcement becomes obvious, the low may already be behind the market. The headline can accelerate participation, but it rarely marks the beginning of the positioning process.
BABA’s archive has shown that sequence repeatedly. July 2024 paired two years of China-negative headlines with record hedge fund flows into the sector. September’s stimulus arrived with the breakout already underway. In December, tariff fears dominated while the underlying data showed no institutional concern and raised the question of what an eventual economic deal would change. April 2025 pointed out that the 2019 trade deal came well after the market had set its low. This week’s summit extended the truce into 2027 while BABA was already in the first pullback after Wave II. The story keeps changing after the positioning has begun.
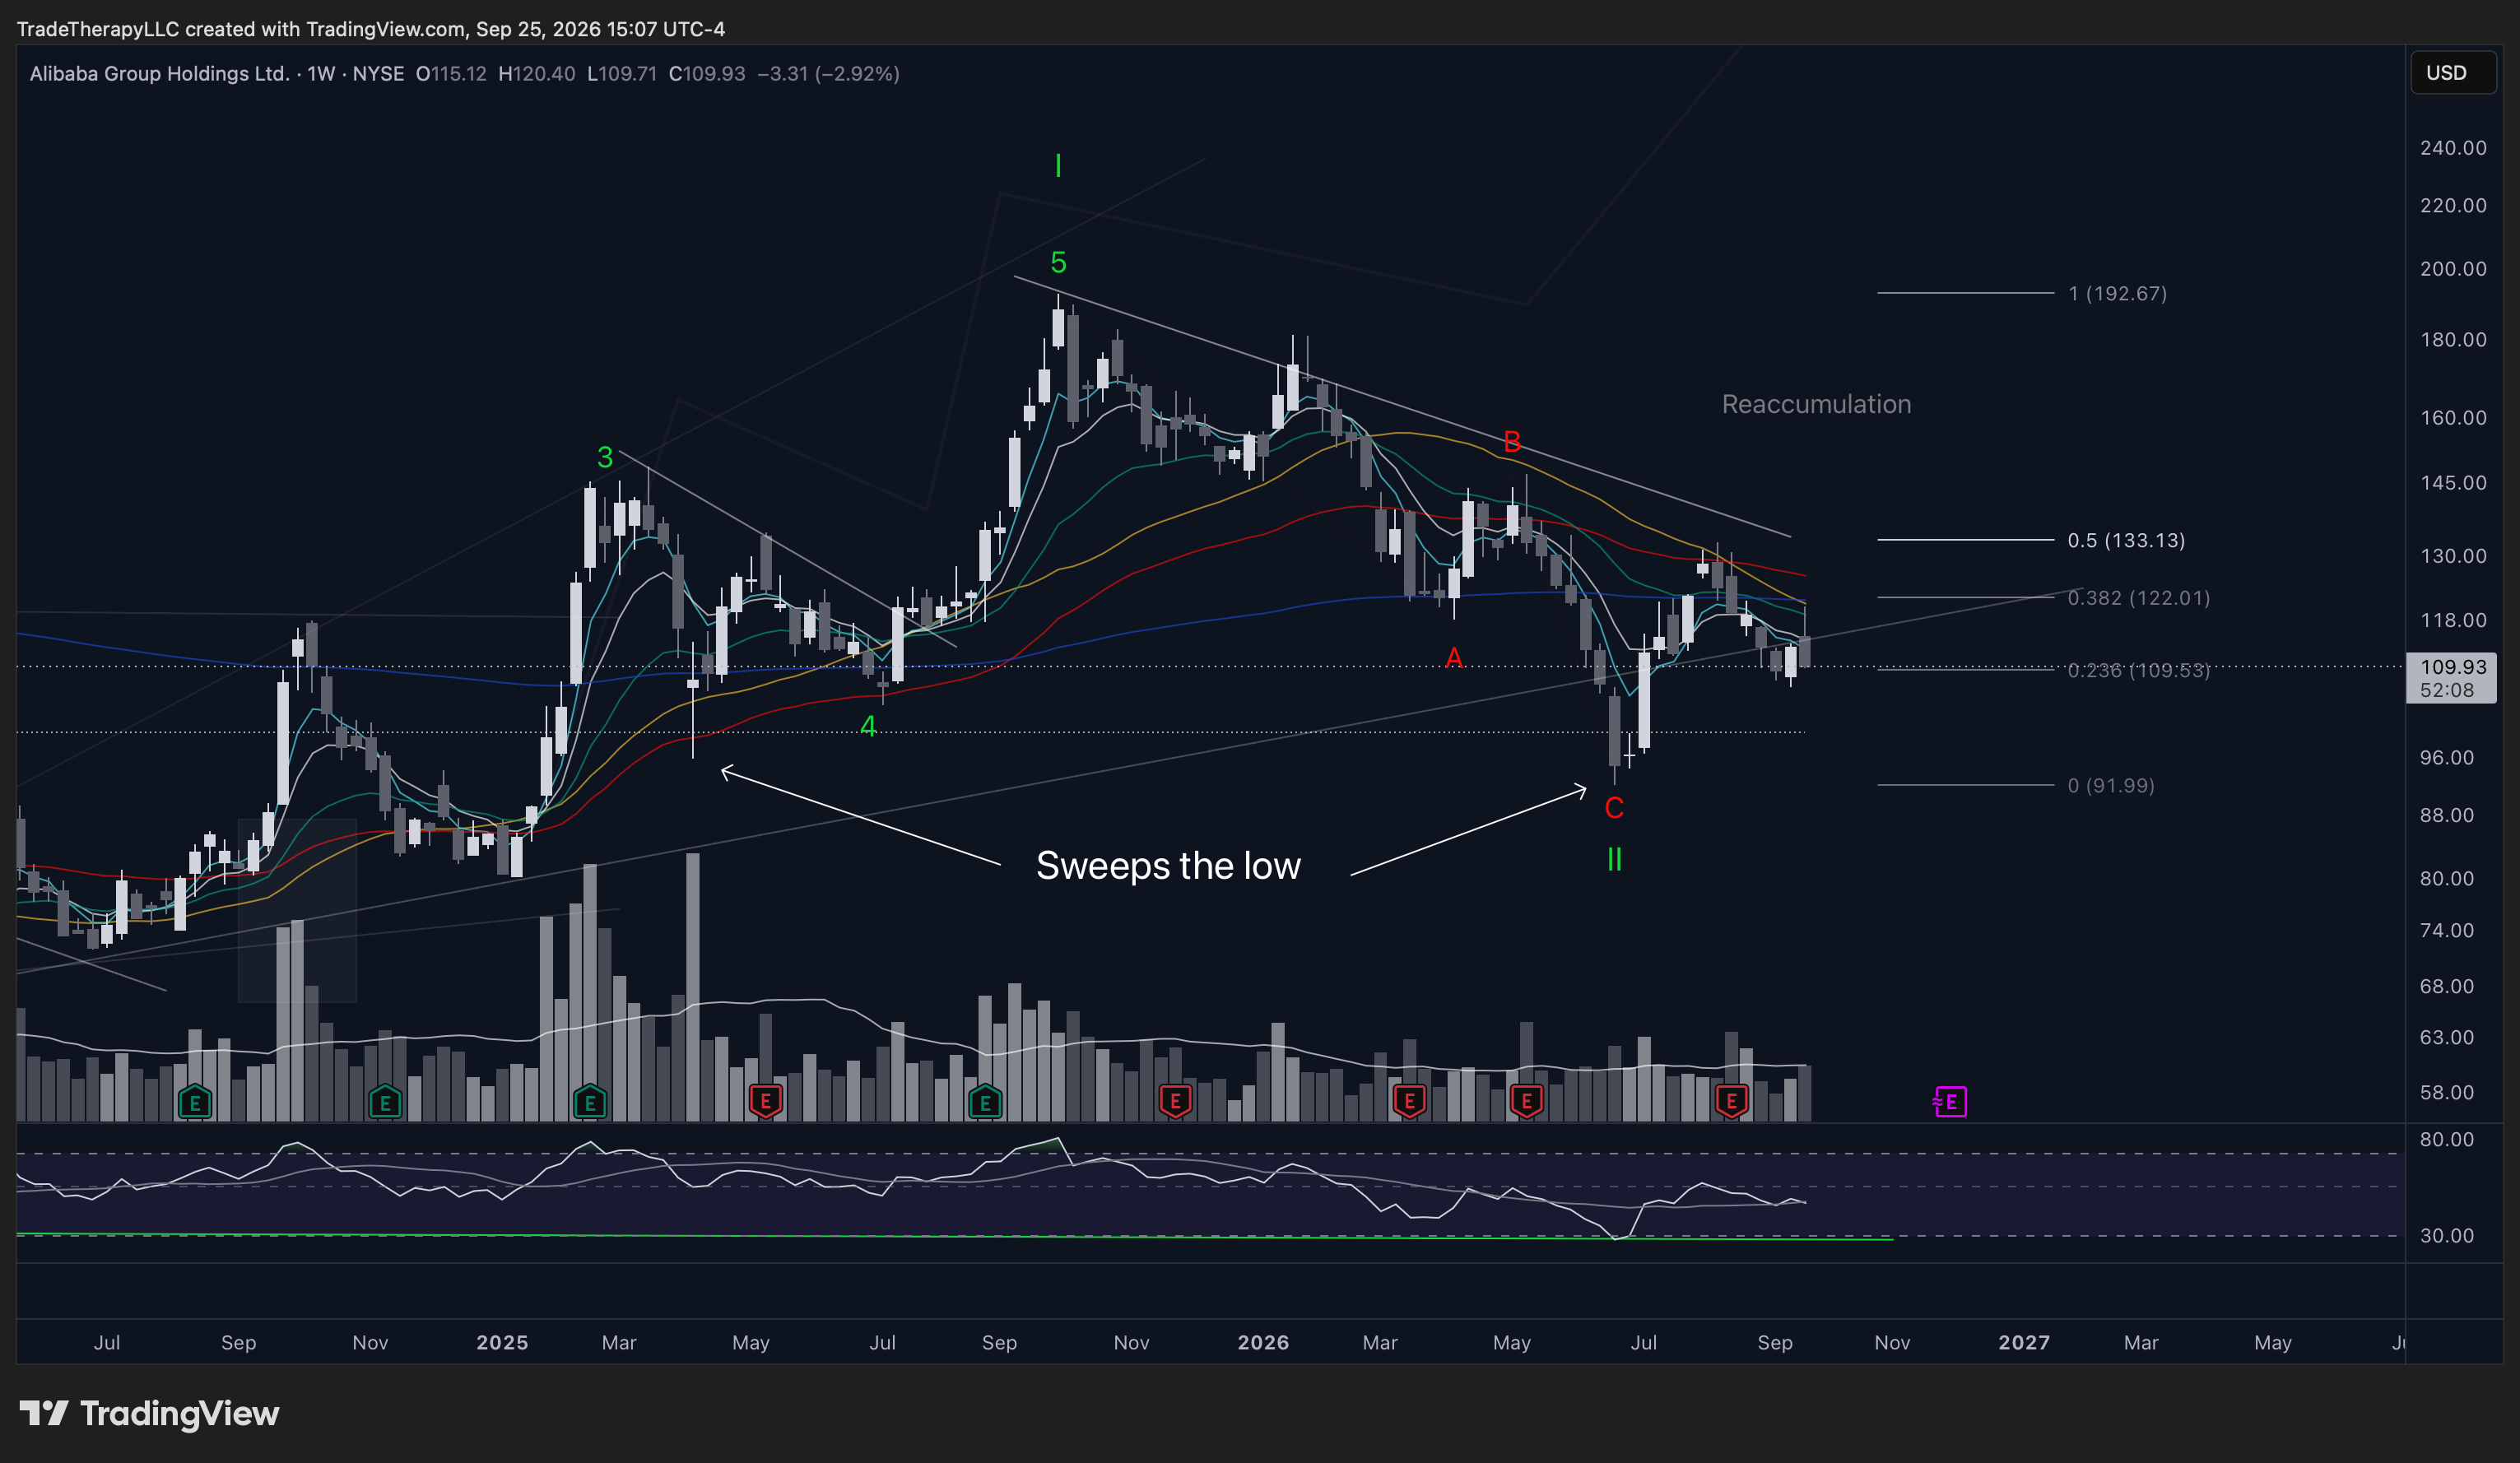
The weekly zoom shows how that shift in ownership was forced. Wave II declined through A-B-C from 192.67 to 91.99, with the C leg sweeping beneath the April 2025 low before demand answered. That prior low was the obvious stop location for anyone who bought the 2025 range. Once price pushed through it, those stops became forced liquidity available to larger buyers trying to fill size.
The archive sharpens that location. April 2025 described the low as a fatal shakeout with institutional volume arriving at the 30-week SMA. Wave II’s C leg returned to the same area where supply had previously been absorbed, then pushed through it. The backtest ran as low as available supply allowed before demand responded.
Who was selling is as important as how far price traveled. Volume through the A-B-C decline remained well below the participation seen during the 2025 advance, even as price moved through the obvious stop level. That contraction points to weak-hand liquidation rather than professional supply overwhelming the market. The green RSI line marks a completed bullish divergence at the C low, adding another piece of evidence that the decline was losing force as the liquidity sweep matured.
Wave II ended at 91.99 almost directly against the separate Wave I 0.618 retracement at 91.76. Price has since recovered to the 0.236 at 109.53 on the 91.99 to 192.67 grid while also returning to the rising demand line. The question has shifted from whether sellers could force another low to whether buyers can keep the first recovered level from being handed back.
Obvious support attracts obvious stops. If institutions still need liquidity, stopping exactly where everyone expects can leave too many shares unavailable. Driving price through the level forces weak holders, recent buyers, and stop orders to sell at the same time, creating the volume needed for stronger hands to transact without chasing price higher.
The overshoot alone does not prove accumulation. The distinction appears in what happens to effort and result afterward. In BABA, price swept the prior low while volume contracted relative to the Wave I advance, momentum completed a bullish divergence, and the market recovered back toward the first repair level. That behavior is consistent with a backtest exhausting weak supply rather than professional distribution expanding into the decline.
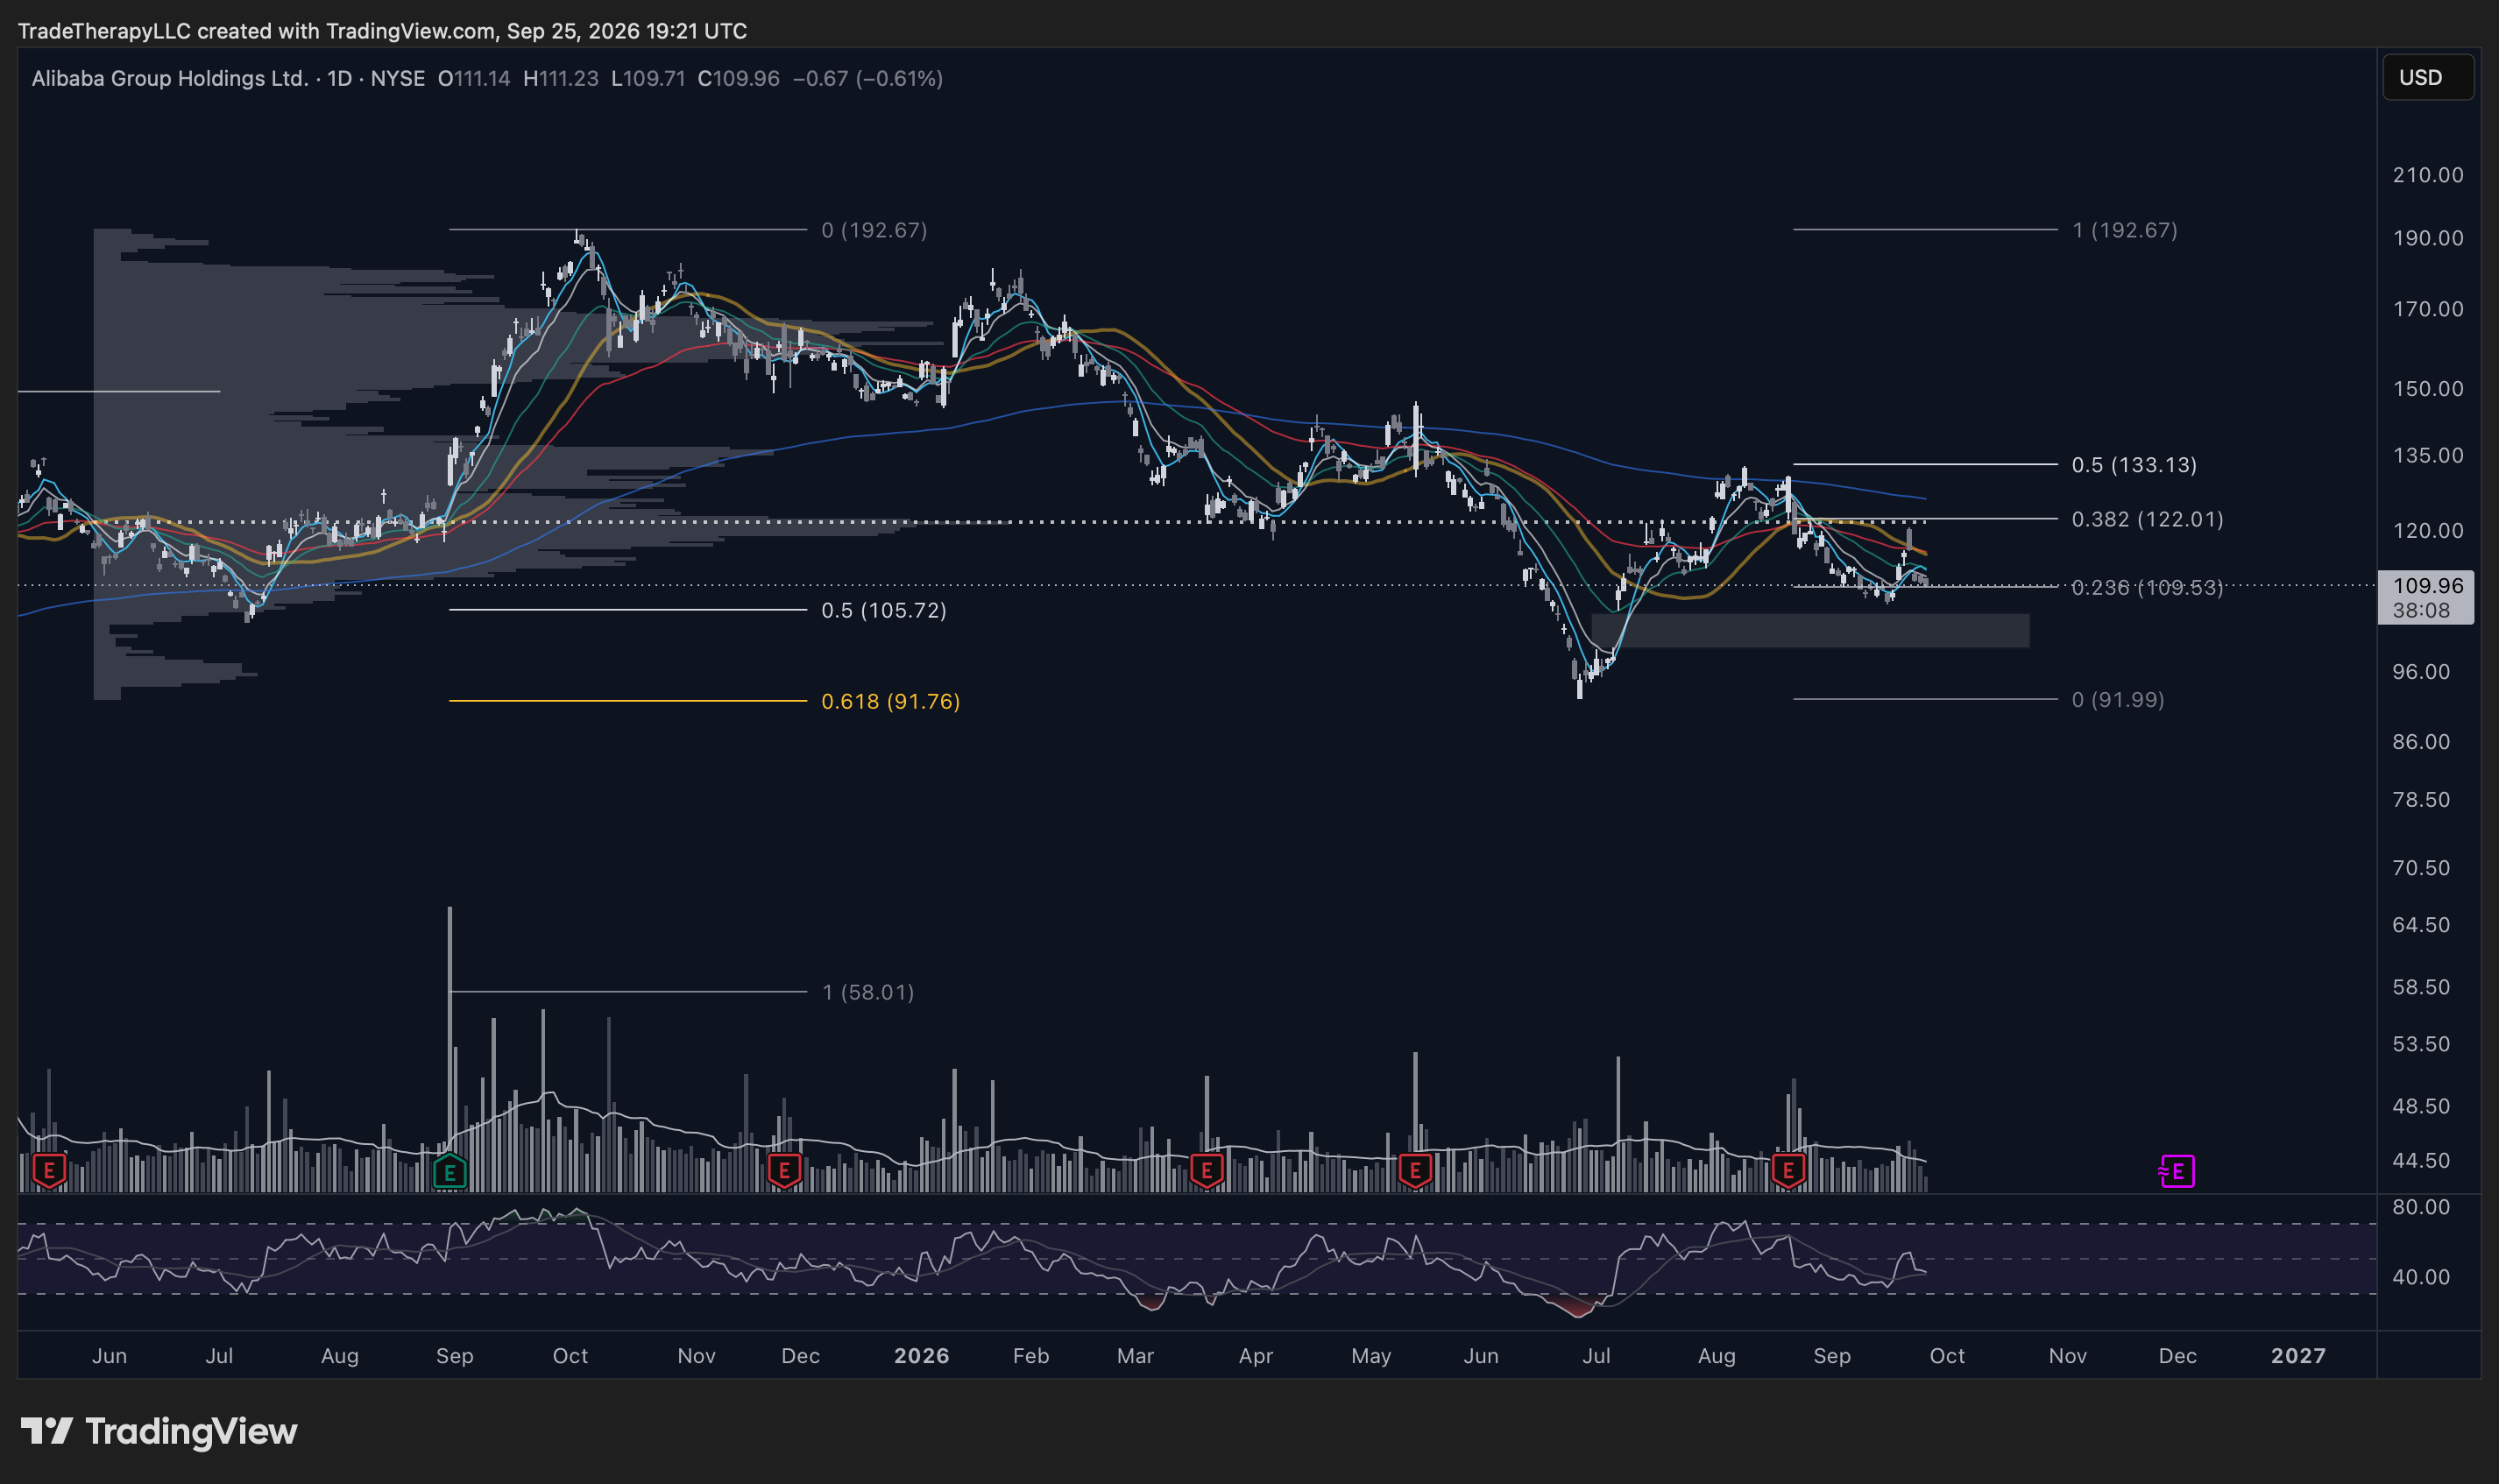
The August rally exposed the first major source of overhead supply left by Wave II. As price recovered into the 0.382 to 0.5 region of the 91.99 to 192.67 grid, holders trapped during the decline had an opportunity to sell closer to break-even. That supply met the rally near the descending trend line and interrupted the first repair attempt.
The current pullback is testing what happened to those shares. If stronger demand absorbed what was released into the August rally, the next decline should travel less efficiently and begin forming a higher floor. If that supply was only partially absorbed, price can continue backtesting until another area of established institutional buying attracts demand.
The low 100s are especially important in that respect. July 2025 identified 102 to 107 as the buying range immediately before the final leg of Wave I launched. BABA has now returned to the same neighborhood. Institutions returning to an area where they previously accumulated are being asked whether they will defend those entries again. The separate Wave I grid places its 0.5 at 105.72 near the shaded gap zone, giving that location an additional structural reference without combining it with the current repair grid.
Price is presently testing the 0.236 at 109.53 while sitting near the rising line, with 122.01 overhead and the faster daily averages still needing to be reclaimed. Those levels describe where the institutional test is taking place. The read itself is whether demand can absorb the supply released by trapped holders and convert this pullback into the first higher floor after Wave II.
The timing adds another layer. This pullback ran through summit week, meaning positioning was already occurring into the headline rather than beginning as a reaction to it. The truce extension changed the public narrative while the market was already testing whether prior buyers would defend their ground.
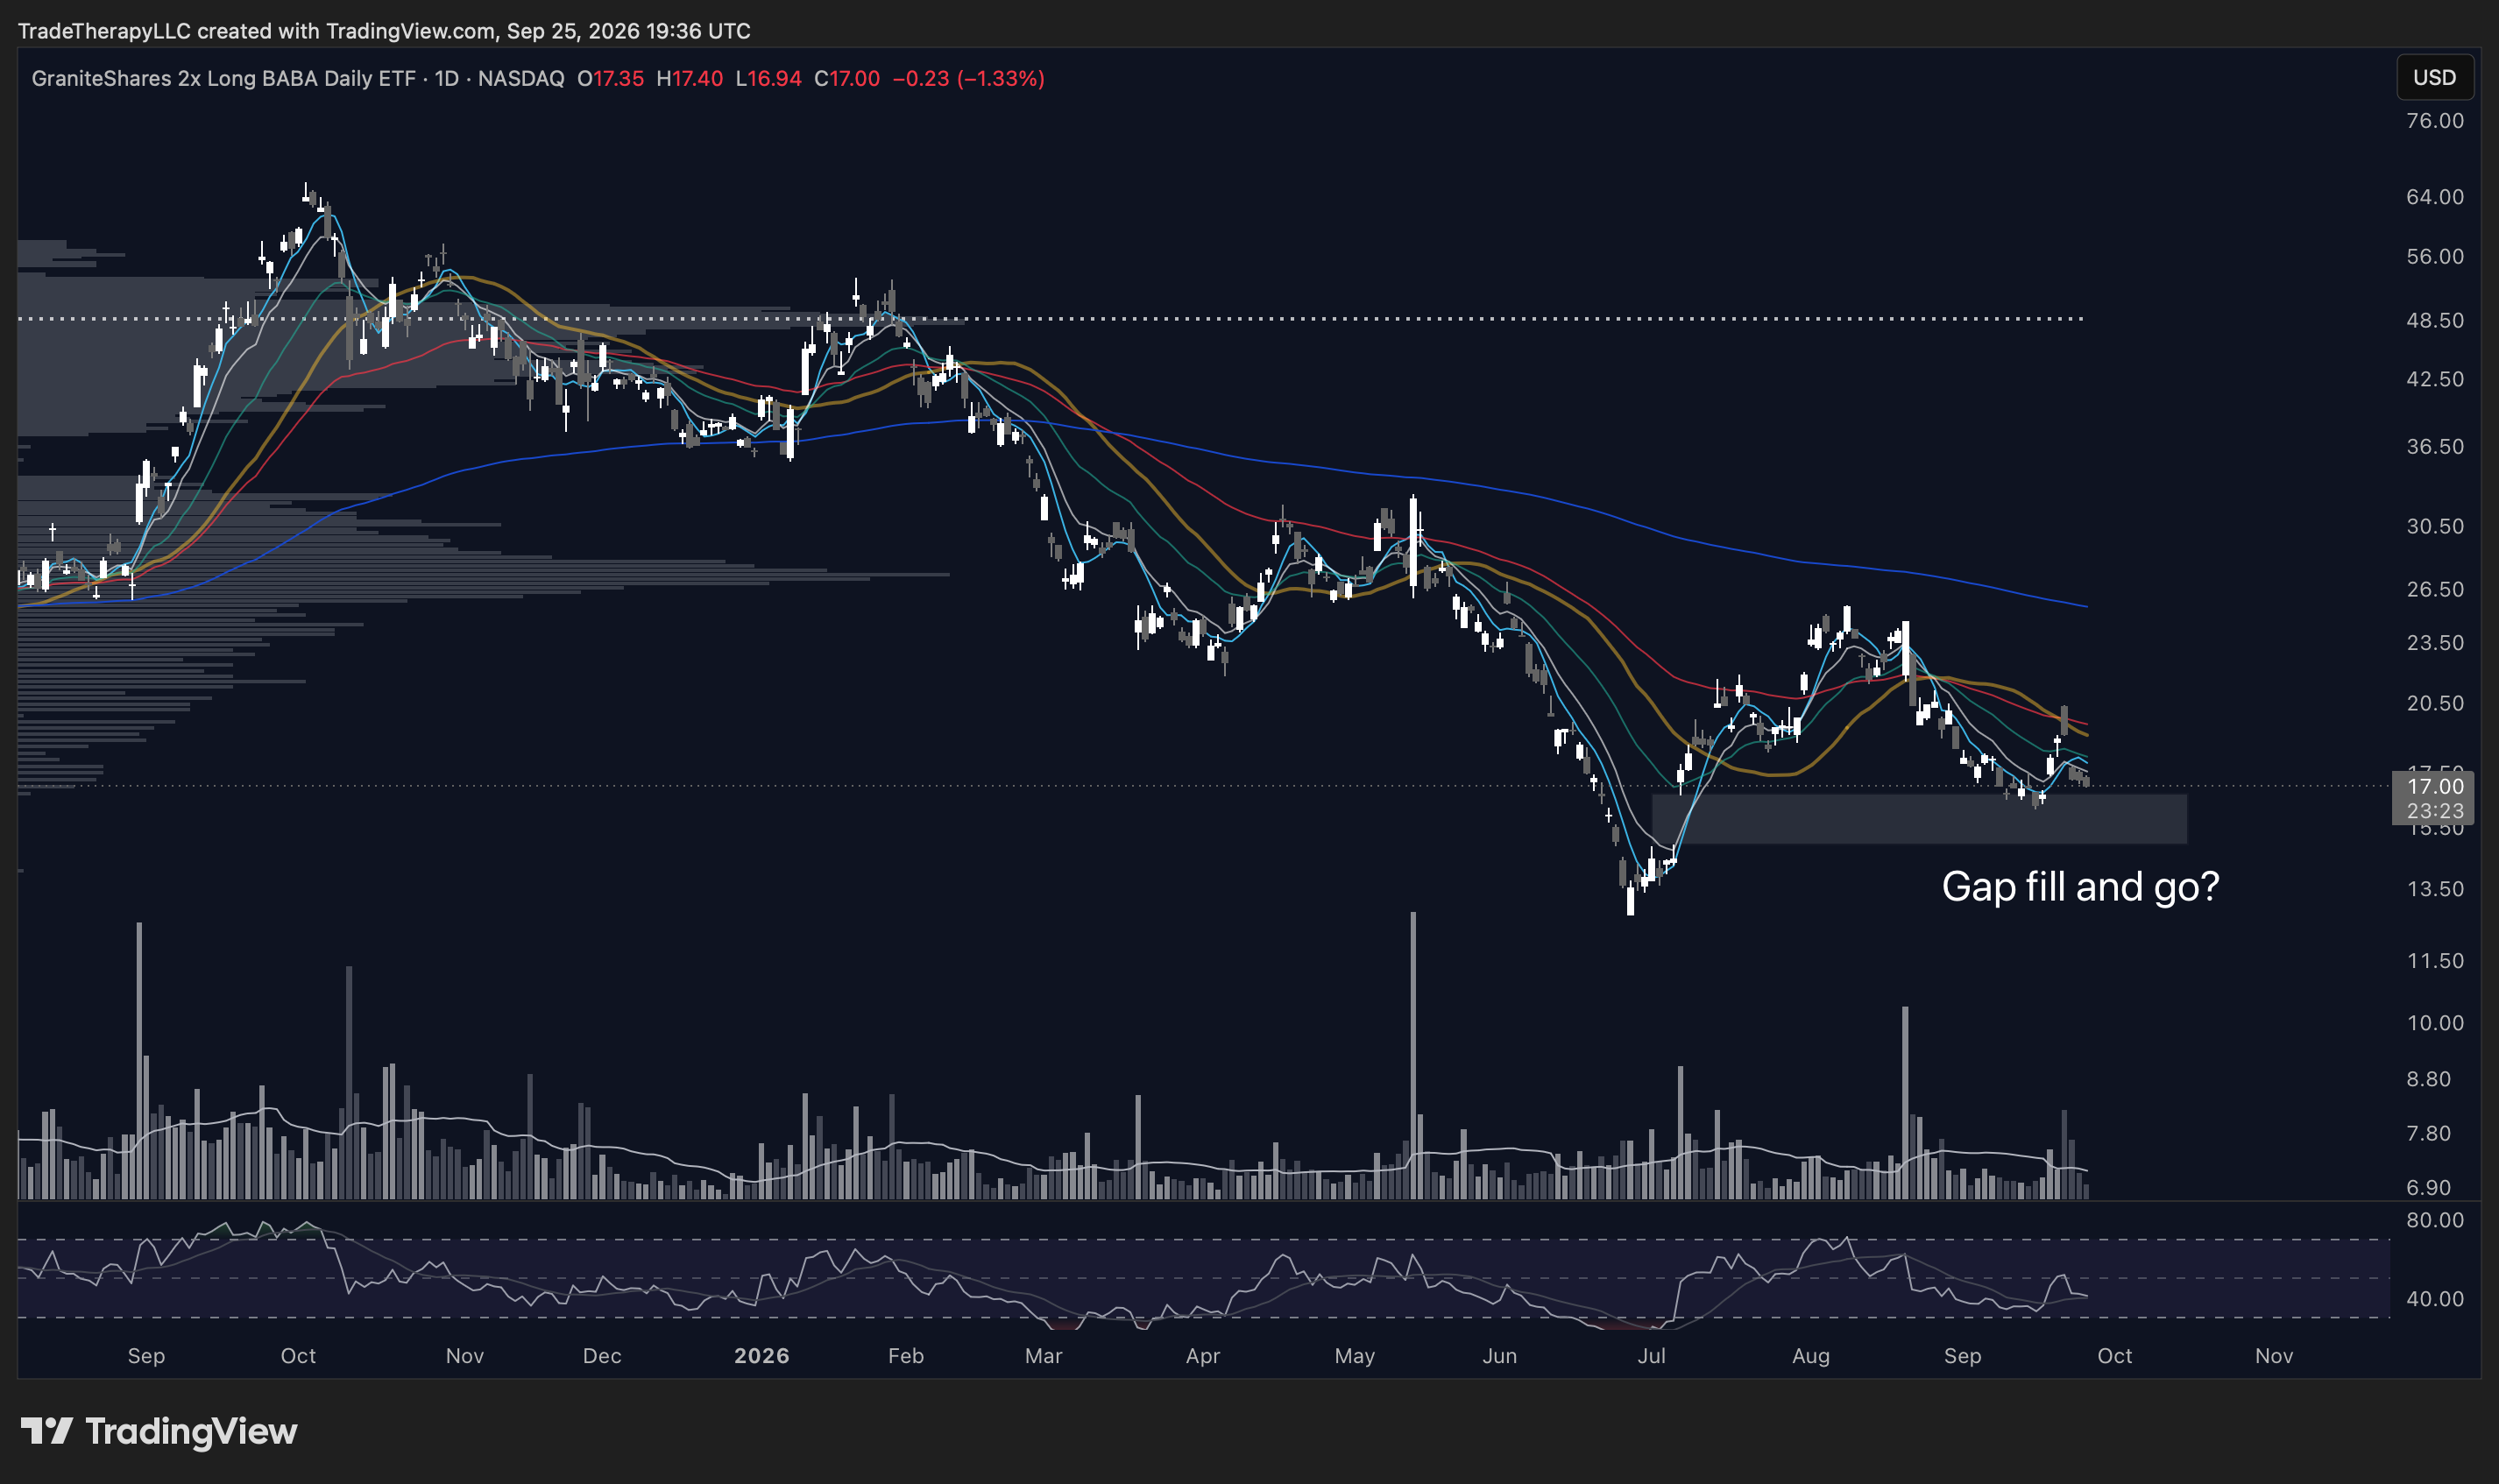
BABX shows the cost of the prior advance more aggressively because leverage magnifies both sides of the campaign. Holders who bought above 40 are now deeply underwater. That creates a large pool of trapped leveraged positions that can become supply whenever rallies carry price back toward their entries.
The current pullback into the shaded “Gap fill and go?” area has occurred on much quieter volume than the major participation spikes seen in May, July, and August. That quietness means the trapped cohort has not capitulated in size during this decline. Those positions are still there.
That has consequences for the next rally. Higher-beta participation can improve while still running into sellers who are simply trying to reduce losses. The farther BABX travels upward, the more of those underwater holders it is likely to encounter. A sustainable advance therefore requires repeated absorption of overhead supply rather than one sharp rebound.
BABX remains a participation read only. Its role is to show whether leveraged appetite is improving enough to absorb its own trapped holders while BABA repairs underneath. Quiet selling helps, but the proxy still has to prove that future rallies can travel through supply rather than repeatedly stall beneath it.
Featured Summary
Exhaustion is the first half. Promotion is the second.
BABA’s campaign has moved from accumulation, through Wave I markup, into a Wave II ownership reset. The 2022 to 2024 base gave early institutional holders entry levels far below current price, while the run toward 192.67 attracted a newer group of buyers much higher in the structure. Wave II forced those later holders through a much deeper test and returned shares toward areas where stronger hands had previously accumulated them.
The C leg to 91.99 did the most important work of that correction. It swept the April 2025 low, triggered an obvious pool of stops, and returned to the same location where institutional volume had appeared previously. Volume contracted relative to the Wave I advance while momentum completed a bullish divergence, suggesting that the sellers being forced out were increasingly weak holders rather than professional supply entering the market.
The first rebound then encountered a different kind of supply. Trapped holders from the decline used the August rally into the 0.382 to 0.5 region to sell closer to break-even. The current pullback is now testing whether those shares were absorbed. That is why 109.53, the rising line, and the low-100s buying area are important. They identify where institutional demand has to show itself if the process is nearing completion.
The larger Wave III? remains conditional because exhaustion and accumulation are only the first half of the process. Demand still has to promote a higher floor, reclaim overhead trend layers, and demonstrate that trapped supply can be absorbed without reopening the Wave II low. That is the evidence the next phase has to produce.
Scenarios
109.53 first, 91.99 last.
The bullish path begins with absorption during the current pullback. Sellers from the August recovery have released shares back into the market, and demand now has to prove that those shares can be taken in without allowing price to accelerate lower. Holding around 109.53 and the rising line would be the first evidence that the post-Wave II repair is beginning to produce a higher floor.
A deeper probe into the low-100s can still fit that process. The 102 to 107 area was the buying range that preceded the final Wave I leg, and the separate Wave I 0.5 at 105.72 sits nearby. If institutions remain committed to positions acquired in that region, renewed buying should appear as price revisits their prior entries. The important behavior would be stabilization and recovery rather than the precision of the touch.
The next institutional test comes from trapped supply overhead. Reclaiming 122.01 would mean buyers have absorbed enough of the shares released during the first rebound to carry price back through an area where the August rally failed. Continued acceptance toward 133.13 would show that even more of the Wave II overhang has been cleared.
Wave III gains credibility through that sequence of behavior: absorption on weakness, defense of prior buying areas, higher floors, and successful passage through trapped supply. The bullish case strengthens as each recovered area stops behaving like an exit window and begins acting like support.
The bearish path develops if supply continues to produce more downside than demand can absorb. A sustained loss of 109.53 and the rising line would show that the first rebound from Wave II failed to establish a durable floor and that the supply released during the August rally remains heavier than current demand can handle.
That would push the test back toward the low-100s, where the prior 102 to 107 buying range and the separate 105.72 reference sit. This area is important because it represents prior institutional buying. If the buyers who accumulated there no longer defend it, the market would be signaling that the ownership structure has changed and that the Wave II reset may not be complete.
Continued failure through that zone would bring 91.99 back into focus. That level defines the current Wave II low and marks the point where the last liquidity sweep finally found demand. Losing it would mean the market has reopened the very area the correction was supposed to clear, forcing the working count to be reassessed.
Only after that failure would the all-time macro grid become the more relevant lens, with 86.76 as the 0.236 reference. The bearish path is therefore defined by a breakdown in institutional behavior: absorption fails, prior buying areas are no longer defended, and the Wave II low cannot hold.
Trade Considerations
Positioning notes, by name.
These are our thoughts on entering or managing trades at the time of publication and are intended to be educational. Do not consider these considerations to be personal financial advice.
These are thoughts on entering or managing trades at the time of publication and are intended to be educational. Do not consider these to be personal investment advice.
These are thoughts on entering or managing trades at the time of publication and are intended to be educational. Do not consider these to be personal investment advice.
These are thoughts on entering or managing trades at the time of publication and are intended to be educational. Do not consider these to be personal investment advice.
These are thoughts on entering or managing trades at the time of publication and are intended to be educational. Do not consider these to be personal investment advice.
These are thoughts on entering or managing trades at the time of publication and are intended to be educational. Do not consider these to be personal investment advice.
Final Thoughts
Between selling exhaustion and renewed expansion.
The China complex has finished a large portion of its corrective work, but the next few weeks have to show whether demand can turn those completed declines into durable higher floors. EEM continues to provide the strongest outside support near new highs. Inside China, the evidence is earlier in the process. FXI is trying to establish a higher low, JD remains beneath supply, FUTU has recovered 102.54, and leveraged participation has not yet reclaimed its trend layers.
That puts the emphasis on retention. The first rebound from an exhausted decline can happen quickly because available selling has already thinned. The stronger evidence comes when the market is tested again and buyers refuse to surrender the recovered ground. FXI needs to hold above its June c low and work through the compressed averages. FUTU needs to turn its reclaimed level into support. JD needs to convert demand into a meaningful reclaim of overhead structure.
BABA is sitting directly inside that same test. The first rebound after Wave II encountered trapped holders on the way up, and price has returned to 109.53 as those shares are worked through the market. A response here, or from the low-100s area on a deeper test, would show that demand remains willing to defend the repair. Recovery through 122.01 would then show that some of the overhead supply left by Wave II is being cleared. A loss of 91.99 would change the read entirely.
The next phase does not require a straight-line advance. It requires evidence that each pullback is becoming less effective at producing downside while recovered areas begin holding for longer. If China can start promoting floors while EEM remains strong, the internal rotation will look very different several weeks from now. Until then, the campaign remains in the handoff between selling exhaustion and renewed expansion.
Long FUTU and BABX. No current position in EEM, FXI, JD, YINN, YANG, or BABA.
Our next Live Chart Review Session is Wednesday, September 30, at 6 PM Pacific. We’ll walk through this week’s charts and take as many questions as possible. Log in details will be emailed Wednesday morning.
The BABA Campaign Playbook
Every Clarity edition on Alibaba, assembled into a single campaign read: the 2022 accumulation, the Wave I markup, and the levels identified along the way, with the record of how each one resolved. It’s the full arc behind this week’s analysis, in one place. Members can order it here (scroll down to the Alibaba Campaign Playbook): tradetherapyllc.com/research
10a-2p PDT Mondays & Tuesdays, $150/30 mins. Email: contact@tradetherapyllc.com.
Check The Basics for chart help, welcome aboard!
Video Note: We’ll be posting video(s) here on Monday!
Disclaimer: Trade Therapy, L.L.C. content is intended for US recipients only. Our information and analysis do not constitute an offer or solicitation to buy any security and are not intended as investment advice. Content should be used alongside thorough due diligence and other sources. Opinions and analyses are those of the author at the time of publication and may change without notice. Trade Therapy, L.L.C. and its employees may move in or out of any trades detailed within our content at any time at their discretion. Employees and affiliates of companies mentioned may be customers of Trade Therapy, L.L.C. We strive for transparency and independence, and we believe our material does not present a conflict of interest. All content is for educational purposes only.
Headlines used for educational analysis under fair use; all rights reserved by original publishers.

The market closed the week near its highs, and the read stays constructive, but the top of the tape has gone visibly two-sided. The S&P 500 pressed the 773.87 to 780.51 shelf it stalled at earlier in September, the Nasdaq 100 cleared the 730.35 extension that had capped it only a week ago, and the Russell 2000 sat right under its 283 objective. What we are watching is participation rather than price, because the large-cap complex is carrying the same completed momentum divergences into these highs that we have identified for several weeks.
The single standout to the upside was Microsoft, which closed through the 467.88 objective we identified by a wide margin, finishing the day up more than three and a half percent and resolving that campaign higher. Underneath the surface, the financials are the group quietly rolling over from the top. The bank ETF slipped below the level we identified as its hold, the regional banks rolled back inside their channel, Goldman Sachs pulled back beneath the pivot we flagged with an open distribution question, and JPMorgan retreated to its cascade line. Bank of America is the one member of that group still advancing cleanly, without the divergence the others carry.
Risk appetite in semiconductors snapped back hard off the September low, and the crypto-linked miners recovered off their summer lows without yet reclaiming the levels we identified as their bases. China stayed mixed, with Alibaba falling back into its accumulation base rather than breaking down, and the emerging-market complex firmer. Dogecoin remains the one name on our featured board still trading well below the structure it lost.
These roster names are sitting within a few percent of a level we have identified as meaningful, so the next move is where they resolve it. We show the level and the direction it implies, not a prediction.
The phase a name is in tells you who already owns the position, and that tells you how a move is most likely to resolve and how to read the headlines around it. When a name is in accumulation, re-accumulation, or markup, the large buyers built their line earlier and are not chasing it here, so a frightening headline tends to resolve in a way that supports the campaign, either by selling a spike to process profit or by defending a range to rebuild. When a name is in distribution, or has just lost a level, the opposite tends to hold, and rallies are better understood as the large sellers stepping out. This is offered as a tendency we have identified across cycles, for education, not as a prediction.
The S&P 500 is confirmed in its advance, but the crest carries a completed momentum divergence, so a push through 773.87 that holds is the campaign extending, while a rejection there is where distribution would begin to show. The Russell 2000 is sponsored and pressing 283 from below, so dips tend to be bought while breadth holds. Walmart is the two-sided case by design, because the research identified both a repair and a lower leg, which makes 107.58 the fulcrum and a loss of it the lower path developing as identified rather than a thesis breaking. Communication Services sits in distribution, where the recent high belongs to sellers, so its midpoint is more likely to cap than to launch.
Elevance and Palantir are in re-accumulation and a proof phase, where the reclaim of the pivot says demand is present, so a shake back into it tends to favor the buyers. Costco holds a two-sided read, because ownership built the base but the research also identified a projected spring toward 788, so 922.18 is where the buyers stay in control or invite the deeper reload. Nvidia, the Nasdaq 100, and Chevron are established campaigns pressing objectives from below, where absorption into strength is the more common resolution absent a divergence signal. JPMorgan and Alphabet are the mature, two-sided names, where the owners are long but a distribution or retention question is open, so their support lines are the fulcrums. Bitcoin has an identified completed low, so the back-up holding is the more common path while 77,916 stays underneath. The financials as a group have just lost their hold with a completed divergence, so a bounce there is better read as sellers stepping out until price reclaims and holds. Johnson & Johnson is a mature markup that just cleared its extension, so holding above 265.93 tends to be defended, late-cycle strength rather than a fresh base. UnitedHealth is auditioning to be re-owned, so its decision resolves on whether new demand absorbs the supply. Super Micro clearing its 41.58 pivot weakens the corrective path the research identified, while Arm pressing its 320.83 ceiling from below in a completed, divergent impulse tends to be sold until it reclaims and accepts above. Tesla, DoorDash, Disney, and PayPal are all defending the first pullback after a move, where the base or reset owners tend to defend.
Where each featured name stands against the read we last identified. Prices are Friday’s close, approximate and delayed, for review and education only. This is research, not investment advice.
The wider set of peer and sector names we carry from recent coverage, priced this week for breadth. These are the names behind the featured spotlights, and none is stamped with a final verdict here.